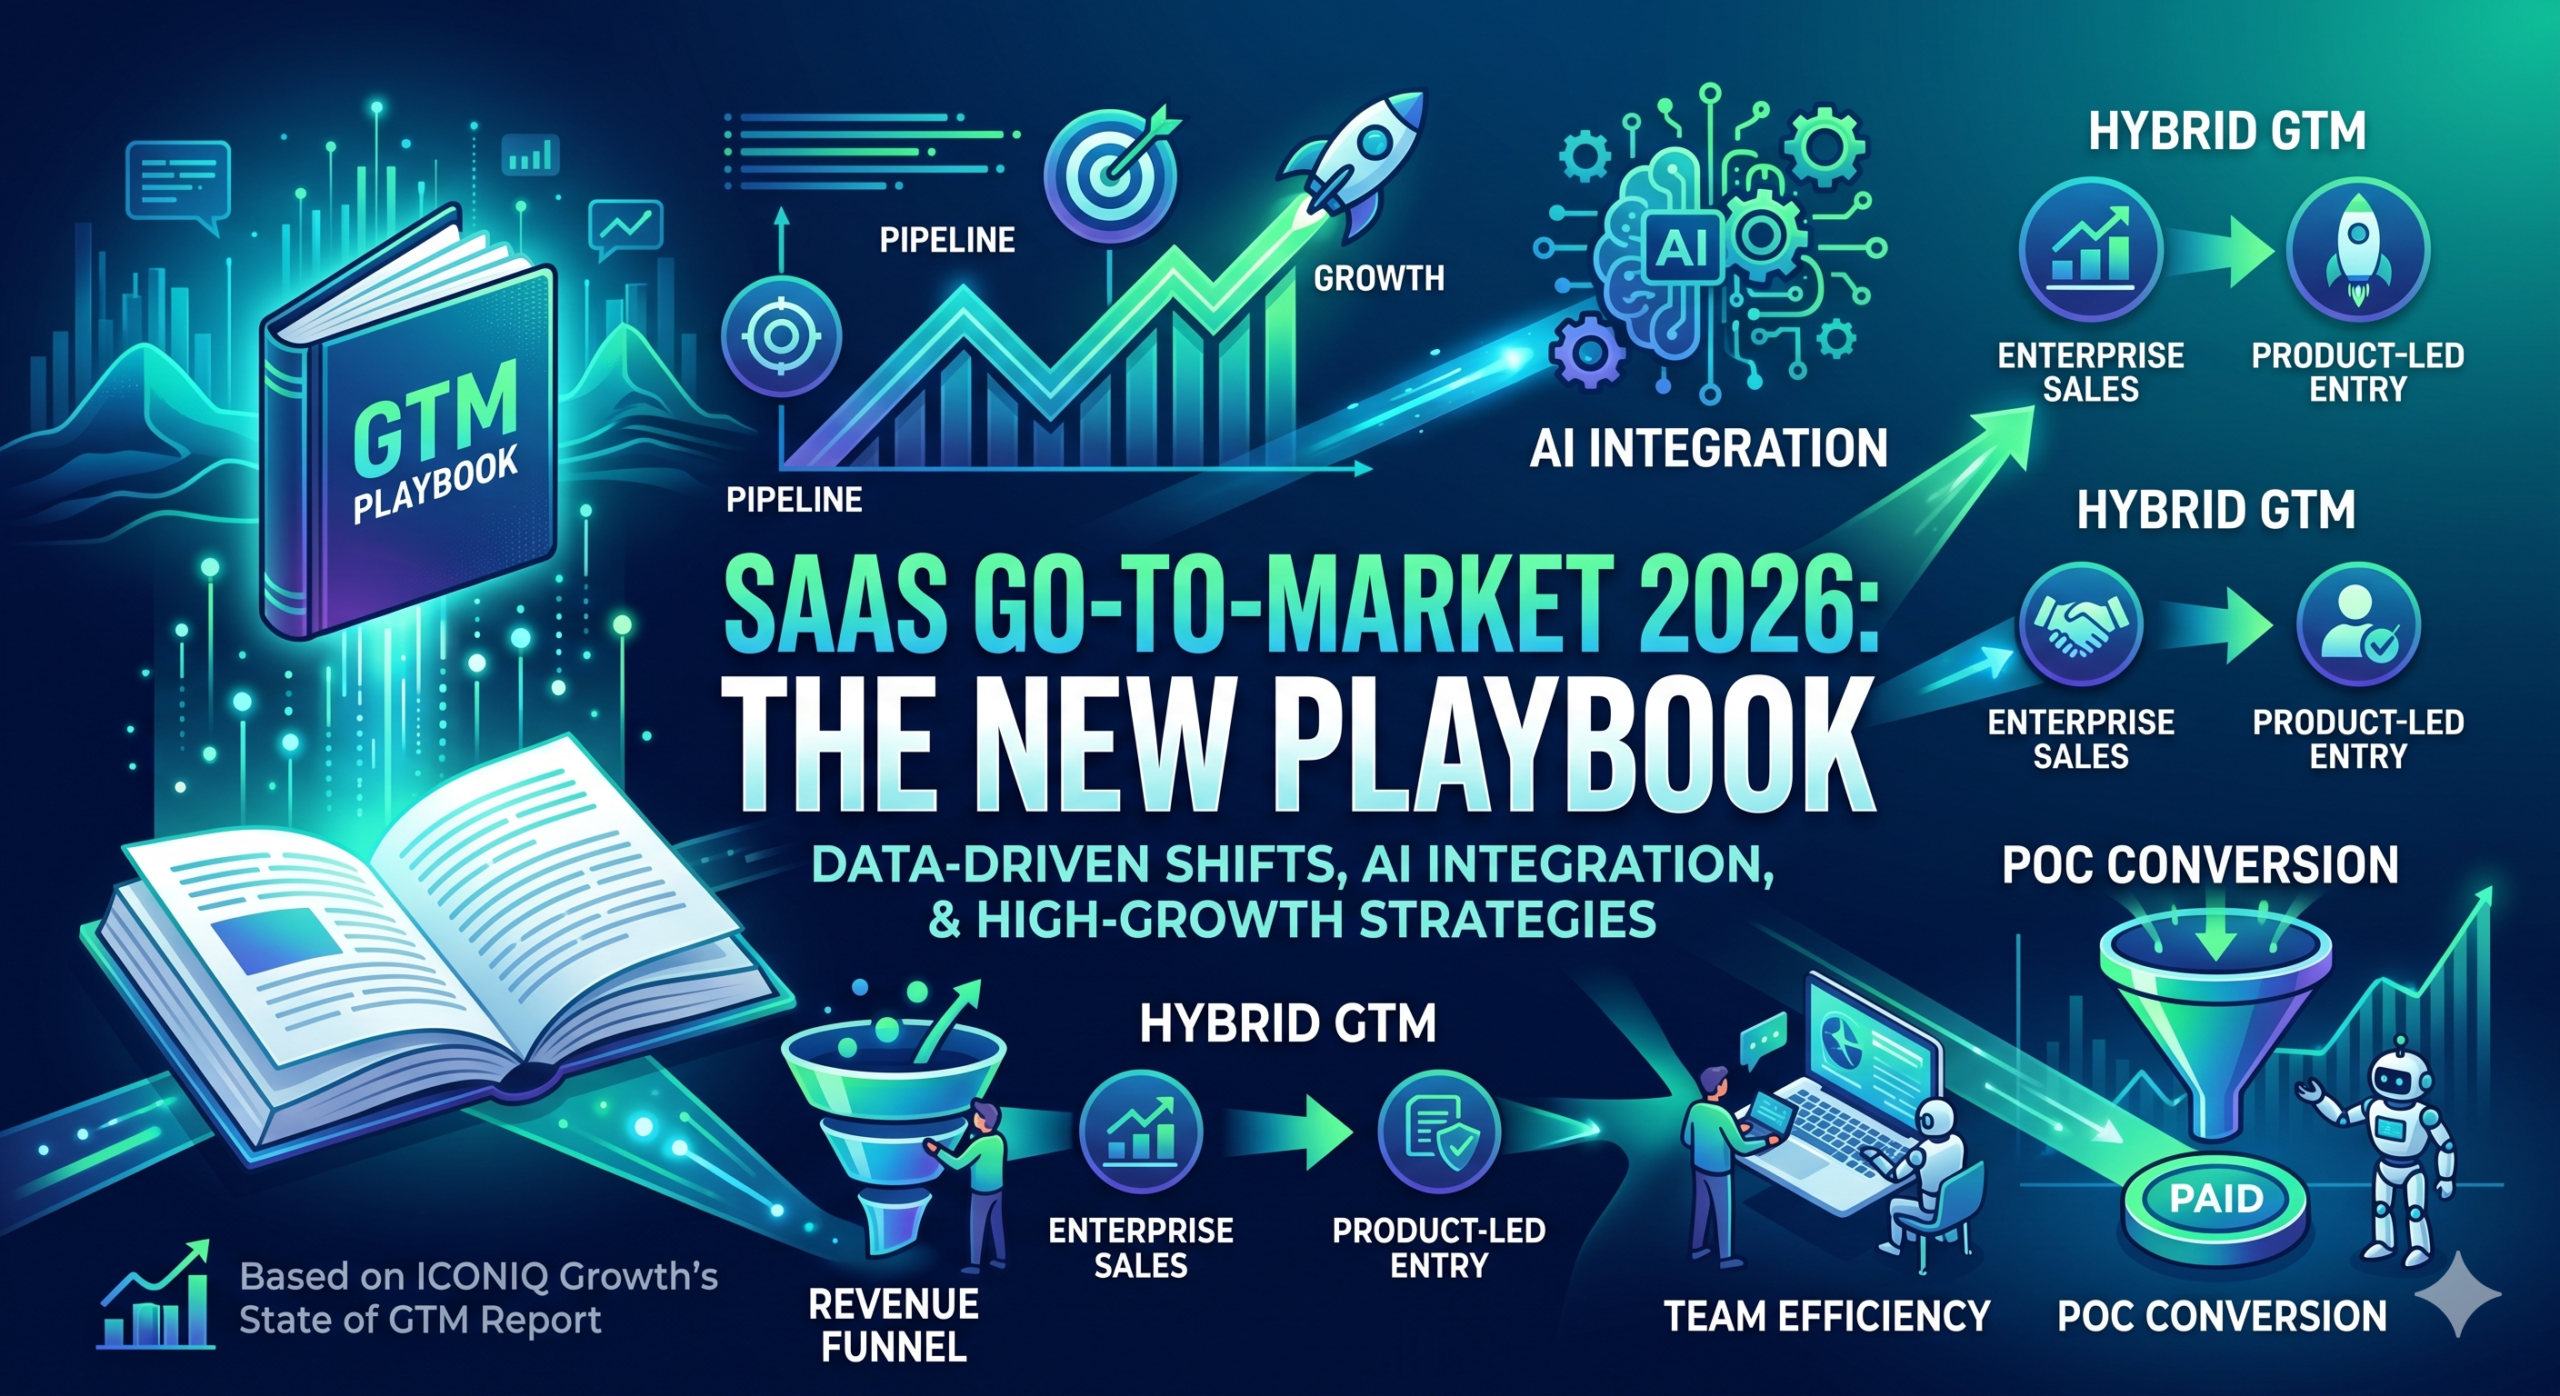
The 2026 SaaS Go-to-Market Playbook Is Being Rewritten — Here’s What the Data Actually Shows
B2B SaaS go-to-market strategy in 2026 isn’t an evolution of what worked in 2022. It’s a structural rebuild. According to ICONIQ Growth’s 2026 State of Go-to-Market report — drawn from data collected across 150+ B2B software GTM leaders spanning early to late-stage companies — the companies pulling ahead are not just growing faster. They’re selling differently, pricing differently, and building leaner organizations with AI embedded across every layer of the revenue funnel.
The headline finding isn’t about any single tactic. It’s about a systematic departure from the playbook that defined enterprise SaaS growth for the past decade. Marketing-led demand generation is losing ground to seller-driven pipeline. Seat-based pricing is giving way to hybrid and consumption models. And AI adoption has crossed the threshold from experiment to operational advantage — but only for the companies that have gone deep.
This post breaks down the three major shifts in ICONIQ’s report and translates them into concrete strategic implications for SaaS founders, operators, and enterprise technology leaders.
Hybrid GTM Has Become the Default — but High-Growth Companies Are Doing It Differently
The ICONIQ data makes clear that hybrid GTM — blending top-down enterprise sales with bottom-up product entry points — is no longer a differentiator. It’s the baseline. What separates high-growth companies from the rest isn’t whether they run a hybrid motion, but how aggressively they lean into the bottom-up component.
While the average company expects self-serve to account for roughly 10% of revenue in 2026, high-growth companies are projecting nearly double that — approximately 20%. This is not a small gap. It represents a fundamentally different view of what self-serve is for. For most companies, product-led entry points remain a top-of-funnel acquisition tool — a way to generate qualified leads for the sales team. For high-growth companies, self-serve is a standalone revenue engine.
This finding challenges a narrative that has persisted in enterprise SaaS for years: that high-ACV, complex products can’t scale through self-serve. The ICONIQ data suggests the opposite — that companies with the discipline and product infrastructure to support genuine self-serve monetization are capturing compounding returns that their sales-led competitors can’t match.
For a deeper look at how PLG and sales-led motions can be balanced for scalable SaaS growth, the tension between these two motions has been building for several years. What ICONIQ’s 2026 data confirms is that the resolution isn’t “pick one” — it’s learning to run both at institutional scale.
Pricing Models Are Evolving — and Hybrid Is Winning
The monetization transformation isn’t just about how companies acquire customers. It’s about how they charge them. Forty-eight percent of companies in the ICONIQ survey now report hybrid pricing as their primary model, with consumption-based and usage-based structures gaining meaningful ground.
This shift reflects a structural change in buyer behavior, not just vendor preference. Enterprise customers in 2026 are resistant to large upfront commitments. The rapid pace of AI development has made multi-year, fixed-seat contracts feel like an overpay for capabilities that may be obsolete or superseded within 12 months. Consumption pricing — where customers pay for what they actually use — is resonating because it aligns vendor and customer incentives in a way that seat-based pricing simply cannot.
The challenge for SaaS operators is that hybrid pricing requires more sophisticated billing infrastructure, revenue recognition, and financial modeling than pure subscription. It also introduces revenue variability that makes forecasting harder. But the ICONIQ data is clear: the revenue quality and net dollar retention (NDR) outcomes from hybrid models justify the operational complexity.
Our analysis of SaaS metrics benchmarks for early-to-mid stage companies has consistently found that hybrid pricing correlates with the highest NRR outcomes — a pattern the ICONIQ report reinforces at scale.
| Pricing Model Breakdown (2026)→ 48% of companies use hybrid as their primary pricing model→ Consumption-based and usage-based structures are gaining ground→ Hybrid pricing correlates with highest NRR outcomes across revenue bands→ Multi-year fixed-seat contracts declining as buyer flexibility demands rise |
How AE Compensation Is Being Restructured — and Why It Matters
One of the more structurally significant findings in the ICONIQ report involves how Account Executive compensation is evolving. Historically, AE pay was tied almost entirely to Gross New ARR, Total Contract Value (TCV), and bookings. These are transactional metrics — they reward deal closure, not customer success.
The ICONIQ data shows that NRR (Net Revenue Retention) and NDR (Net Dollar Retention) are rapidly ascending as AE compensation metrics, rising faster year-over-year than any other benchmark in the report. This is not a minor adjustment to the comp plan. It’s a reorientation of what enterprise sales is for.
When AEs are measured on NRR, they have a direct financial incentive to close deals that will expand. They become more selective about which accounts they target, more invested in successful onboarding, and more attentive to expansion opportunities post-close. In aggregate, this changes the unit economics of customer acquisition — and it changes the relationship between sales and customer success in ways that most organizations are only beginning to work through.
The parallel to the long-running tension between SaaS sales and marketing organizations is instructive. Just as marketing and sales have historically been misaligned on what constitutes a quality lead, sales and customer success have been misaligned on what constitutes a quality deal. NRR-based AE compensation is a structural mechanism for closing that gap.
The Reacceleration Is Real — but It’s Not Evenly Distributed
After a prolonged period of compressed growth and funnel inefficiency following the 2021–2022 valuation peak, the ICONIQ data points toward genuine reacceleration — but with a critical caveat. The recovery is heavily concentrated in smaller companies.
| YoY ARR Growth — Top Quartile (H2 2025)→ Sub-$50M ARR cohort: 111% YoY growth (leading segment)→ $50M–$100M ARR cohort: 91% YoY growth→ $100M+ ARR cohort: 33% YoY growth (significantly lagging)→ Smaller companies are outpacing large-cap SaaS 3:1 on top-quartile ARR growth |
Top-quartile YoY ARR growth is trending upward across most revenue bands, with the sharpest acceleration among companies under $100M ARR. The sub-$50M cohort is leading the pack, while $100M+ companies are showing much more modest momentum. This divergence has real implications for how operators and investors should interpret market-level signals.
For smaller companies, the acceleration appears to be driven by two factors: greater willingness to experiment with hybrid GTM models, and faster AI implementation cycles (less legacy infrastructure to retrofit). Larger companies are dealing with the organizational drag of restructuring enterprise sales motions that were built for a different pricing era.
What the ICONIQ data also reveals is where high-growth companies are generating pipeline. Sales and channel-generated pipeline accounts for 60–80% of total pipeline for high-growth companies, compared to only 15–20% from marketing. This is a significant inversion of the narrative that has dominated SaaS GTM discussions for the past five years — where content marketing, inbound, and demand generation were treated as the primary pipeline engines.
Free Trials and POCs Are Now Your Highest-Converting Sales Motion
One of the most actionable findings in the ICONIQ report is the dramatic improvement in free trial and proof-of-concept (POC) conversion rates. In 2025, the conversion rate from free trial or POC to paid was approximately 36%. In 2026, it has jumped to roughly 50% — a 14-percentage-point gain that outperforms every other funnel stage.
By comparison, traditional SQL (Sales Qualified Lead) and demo-to-opportunity paths are converting at 30–40%. This gap has real implications for how SaaS companies should be structuring their sales process and allocating pre-sales resources.
Companies investing in structured POC support — particularly at higher ACVs where the stakes of a successful evaluation are highest — are seeing the payoff. A well-run POC reduces buyer risk, accelerates internal consensus, and gives the prospect a tangible proof of value before committing budget. In an environment where buyers are skeptical of vendor claims and increasingly AI-literate, the ability to demonstrate measurable impact in a controlled environment is a decisive competitive advantage.
For SaaS companies evaluating their sales strategies, the data makes a compelling case for prioritizing the trial-and-POC infrastructure over incremental investment in top-of-funnel lead generation programs.
| Funnel Conversion Benchmarks (2026)→ Free trial / POC to paid: ~50% (up from ~36% in 2025) — highest-converting path→ Traditional SQL / demo paths: 30–40% conversion→ Sales cycle length: ~19 weeks in 2026 (down from ~25 weeks in 2025)→ Sub-one-year contract terms rising — driven by buyer demand for flexibility |
Sales Cycles Are Shorter — but Contracts Are Getting Shorter Too
The ICONIQ report records an approximately six-week compression in sales cycle length — from roughly 25 weeks in 2025 to about 19 weeks in 2026. On the surface, this looks like unambiguous good news.
The catch is that sales cycle compression is happening alongside a parallel shift toward shorter contract durations. Sub-one-year terms are rising, driven by buyer demand for flexibility in a fast-moving AI landscape where multi-year commitments feel risky. Enterprise buyers are signing faster precisely because they’re committing to less.
This combination — shorter cycles, shorter contracts — creates new pressure on post-sales teams. When customers commit to 12-month or shorter terms, the renewal cycle begins almost immediately after implementation. Customer success, onboarding quality, and early adoption metrics become revenue-critical in a way they simply weren’t under three-year enterprise agreements.
Organizations that built their customer success capacity around long-contract renewal cycles will need to restructure. The math changes fundamentally when you have one year — not three — to demonstrate enough value to justify a renewal and, ideally, an expansion.
AI in GTM: Past Hype, Into Operation
The question in 2026 is no longer whether AI is in your GTM stack. It’s how deep it goes — and whether that depth is translating into measurable outcomes.
The ICONIQ data is unambiguous about the directional relationship: companies with deeper AI integration are outperforming peers across funnel metrics, AE quota attainment, and team efficiency. The gains are most pronounced at the top of the funnel. High AI adopters are seeing lead-to-MQL conversion rates approximately 11 percentage points higher, and MQL-to-SQL rates 8 points higher, than low or non-adopters.
These are not marginal improvements. At scale, an 11-point improvement in lead-to-MQL conversion represents a fundamental change in how much pipeline a given marketing investment can generate.
Where the data gets particularly interesting is in which AI use cases are growing fastest. Transcription and lead scoring have led adoption for the past two years. But the biggest year-over-year gains in 2026 are in mid-funnel and post-sales AI applications: forecasting, renewal outreach, and customer support automation. This is the AI maturity curve playing out in real time — early adopters are moving from productivity tools to revenue-critical infrastructure.
This evolution is consistent with the pattern our own research has tracked in enterprise SaaS AI adoption, where the companies achieving the most durable outcomes are those that embed AI into workflow — not those that deploy it as a point solution.
It also contrasts meaningfully with the broader finding in our analysis of the AI sales productivity paradox, which found that 95% of organizations report no measurable AI ROI — a finding rooted in shallow, point-solution deployments. The ICONIQ data reaffirms this divide: the gap between deep adopters and everyone else is growing, not closing.
| AI GTM Performance — High Adopters vs. Peers→ Lead → MQL conversion: +11 percentage points (high AI adopters)→ MQL → SQL conversion: +8 percentage points (high AI adopters)→ Top use cases: call transcription, lead generation, lead scoring→ Fastest-growing: forecasting, renewal outreach, customer support automation→ 75% of companies measure AI ROI via productivity gains; retention metrics rising fast |
Leaner Teams, Better Results: What AI Is Actually Doing to GTM Headcount
Perhaps the most consequential — and least discussed — finding in the ICONIQ report is the organizational implication of AI adoption. High AI adopters are running leaner GTM teams at every revenue band. The same revenue is being generated with fewer people.
This is not a cost-cutting story. It’s a leverage story. The companies that have embedded AI into forecasting, prospecting, renewal outreach, and customer support are not replacing human judgment — they’re amplifying it. One AE with AI-assisted account research, automated CRM hygiene, and AI-generated outreach sequences can cover more ground with higher quality than two AEs without those tools could a few years ago.
The unit economics implications are significant. If you can grow ARR without proportionally scaling headcount, your sales and marketing expense as a percentage of revenue improves. Your cost per dollar of ARR declines. Your path to Rule of 40 performance gets materially shorter.
For early-stage companies in particular, this represents a strategic opportunity. The 2025 SaaS metrics benchmarks for $1M–$5M ARR companies show that S&M expense efficiency is one of the clearest leading indicators of capital efficiency and valuation readiness. AI-enabled GTM leverage is now a measurable contributor to those outcomes.
How AI ROI Is Being Measured — and Why It’s Changing
The final area of the ICONIQ report that warrants close attention is the evolution of how companies are measuring AI’s return on investment. Productivity gains remain the most common benchmark, cited by approximately 75% of respondents. But customer retention metrics are rising fast as an ROI framework.
This shift is not accidental. As AE compensation moves toward NRR and NDR, and as consumption pricing introduces revenue variability, the definition of AI success is converging with the definition of GTM success: sustainable, retained revenue.
Companies measuring AI ROI against retention are asking a fundamentally different question than those measuring it against productivity. Productivity measurement asks “did my team do more?” Retention measurement asks “did my customers stay and grow?” The second question is harder to answer — and more directly tied to the revenue quality metrics that matter most for long-term company health.
The companies recognizing this convergence early are the ones building durable advantages. They are designing AI implementations not just to save AE time, but to surface renewal risk earlier, personalize expansion outreach, and identify at-risk accounts before churn signals appear in usage data.
What the ICONIQ Findings Mean for Your 2026 GTM Strategy
The 2026 State of GTM report is not a prescription. It’s a set of benchmarks — and benchmarks only matter when you know where you stand relative to them. Here is a practical framework for evaluating your current GTM posture against the key signals in this data.
For SaaS Founders and Operators
- Audit your self-serve infrastructure. If you’re projecting self-serve at 10% or below, you’re at the peer average — not the high-growth standard. What would it take to double that? The answer usually involves product instrumentation, in-app upgrade flows, and dedicated PLG capacity that most teams underinvest in.
- Evaluate your POC motion. If free trial and POC conversion is your highest-performing funnel stage — and the ICONIQ data suggests it should be — are you resourcing it like one? POC support, structured evaluation playbooks, and dedicated pre-sales engineering are not overhead. They’re your highest-ROI sales investment.
- Revisit your AE compensation structure. If you’re still paying AEs exclusively on gross bookings, you’re misaligning incentives with the outcomes that drive company value. Piloting NRR-based components — even at 10–15% of total variable comp — changes behavior in measurable ways.
- Invest in AI depth, not breadth. The ICONIQ data shows that high adopters run leaner teams with better results. The companies losing ground deployed AI as a point tool. The ones gaining ground embedded it into workflow infrastructure — forecasting, renewal signals, pipeline quality scoring.
For Enterprise Technology Leaders
- Pressure-test your vendor pipeline against the AI depth question. The ICONIQ data is clear that AI adoption is bifurcating GTM performance. Vendors who haven’t embedded AI into their own renewal, forecasting, and customer success processes are likely underinvesting in the same capabilities for their customers.
- Prioritize structured POC evaluations. The 50% conversion rate from POC to paid reflects the quality signal that structured evaluations generate. Buyers who invest in structured evaluations get better vendor fit, lower implementation risk, and stronger ROI outcomes.
- Renegotiate contract structures. The shift to shorter contract terms isn’t just a vendor risk management tool. It’s a buyer leverage mechanism. Use contract flexibility to build in performance benchmarks — and make renewals contingent on measured outcomes, not vendor relationship.
- Evaluate self-serve capability as a vendor quality signal. Vendors who can’t support genuine self-serve expansion are likely to require more of your IT and procurement resources at each renewal. Build that total cost of ownership into vendor evaluation scorecards.
The GTM Playbook Has Changed. Have You?
The ICONIQ 2026 State of Go-to-Market report confirms what experienced operators have been observing anecdotally: the B2B SaaS go-to-market strategy that produced compounding results from 2016 to 2021 is not the strategy that will produce results in 2026. Hybrid motions, consumption pricing, NRR-oriented compensation, AI-embedded pipelines, and structured POC infrastructure are no longer best practices for the leading edge. They are table stakes for competitive performance.
The companies that recognize this shift early — and have the organizational discipline to execute against it — are the ones currently pulling further ahead in top-quartile ARR growth, funnel conversion, and AE productivity. The ones that are waiting for clarity before acting are falling further behind with every quarter.
The data is clear. The playbook exists. The question is execution.
| Download the Full Report→ Access the complete ICONIQ 2026 State of GTM at iconiq.com/growth/reports/state-of-go-to-market-2026 → Report covers 150+ B2B SaaS GTM leaders across early to late-stage companies→ DevelopmentCorporate analysis and benchmarks: developmentcorporate.com |