Survive and Scale: 8 Critical SaaS Metrics for CEOs Leading <$20M SLG SaaS Companies
Understanding how your startup firm compares to the competition is crucial for driving growth and valuation. BenchmarkIT and Emergence Capital’s 2025 B2B SaaS Performance Metrics Benchmarks provide fact-based data from 563 firms, sliced on several dimensions (ARR size bucket, Go to market sales motion type (SLG, PLG, Hybrid), Pricing models, etc.). The key metrics include:
- CAC Payback Period (Months) by ARR
- Gross Revenue Retention Rate by ARR
- Net Revenue Retention Rate
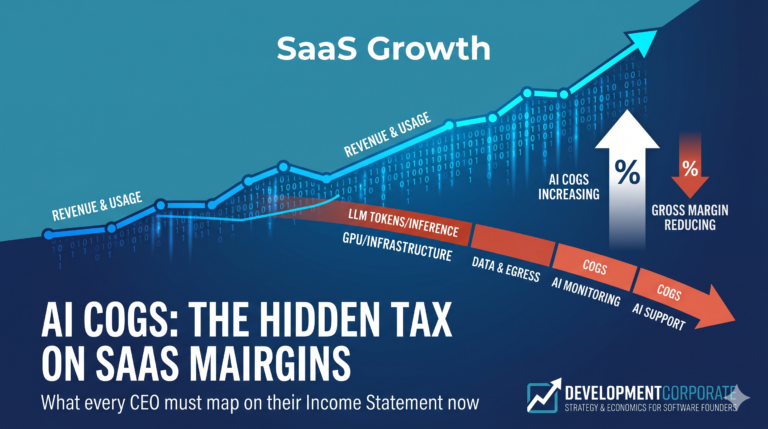
- Gross Margins – Subscriptions by ARR
- Gross Margins – Subscriptions by ACV
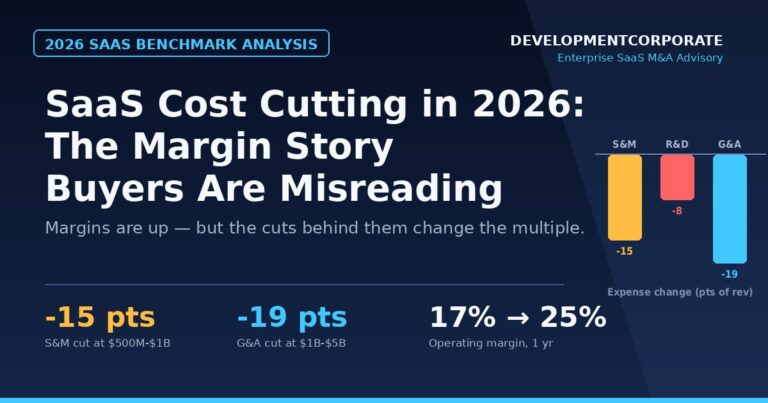
- Sales and Marketing Expenses to Revenue (%)
- Sales and Marketing Expenses to Revenue (%) Public vs Private
- Operating Expenses as a Percentage of Revenue
- Sales and Marketing Expenses to Revenue by ARR
- R&D Expenses to Revenue by ARR
- ARR by Employee
Study Firmographics
ARR

ACV

Solution Type

Go-To-Market Motion

2025 Metrics for <$20M Revenue SLG SaaS Firms
CAC Payback Period (Months) by ARR

| CAC Payback Period (Months) | 1st Quartile | 2nd Quartile | 3rd Quartile | 4th Quartile |
| $1M | 4 | 8 | 9 | 16 |
| $1M – $5M | 4 | 9 | 14 | 18 |
| $5M – $20M | 3 | 14 | 20 | 26 |
Gross Revenue Retention Rate by ARR

| Gross Revenue Retention Rate | 1st Quartile | 2nd Quartile | 3rd Quartile | 4th Quartile |
| $1M | 60% | 85% | 90% | 97% |
| $1M – $5M | 53% | 85% | 90% | 97% |
| $5M – $20M | 30% | 77% | 88% | 93% |
Net Revenue Retention Rate

Gross Margins – Subscriptions by ARR

Gross Margins – Subscriptions by ACV

Sales and Marketing Expenses to Revenue (%)

Sales and Marketing Expenses to Revenue (%) Public vs Private

Operating Expenses as a Percentage of Revenue

Sales and Marketing Expenses to Revenue by ARR

R&D Expenses to Revenue by ARR

ARR by Employee