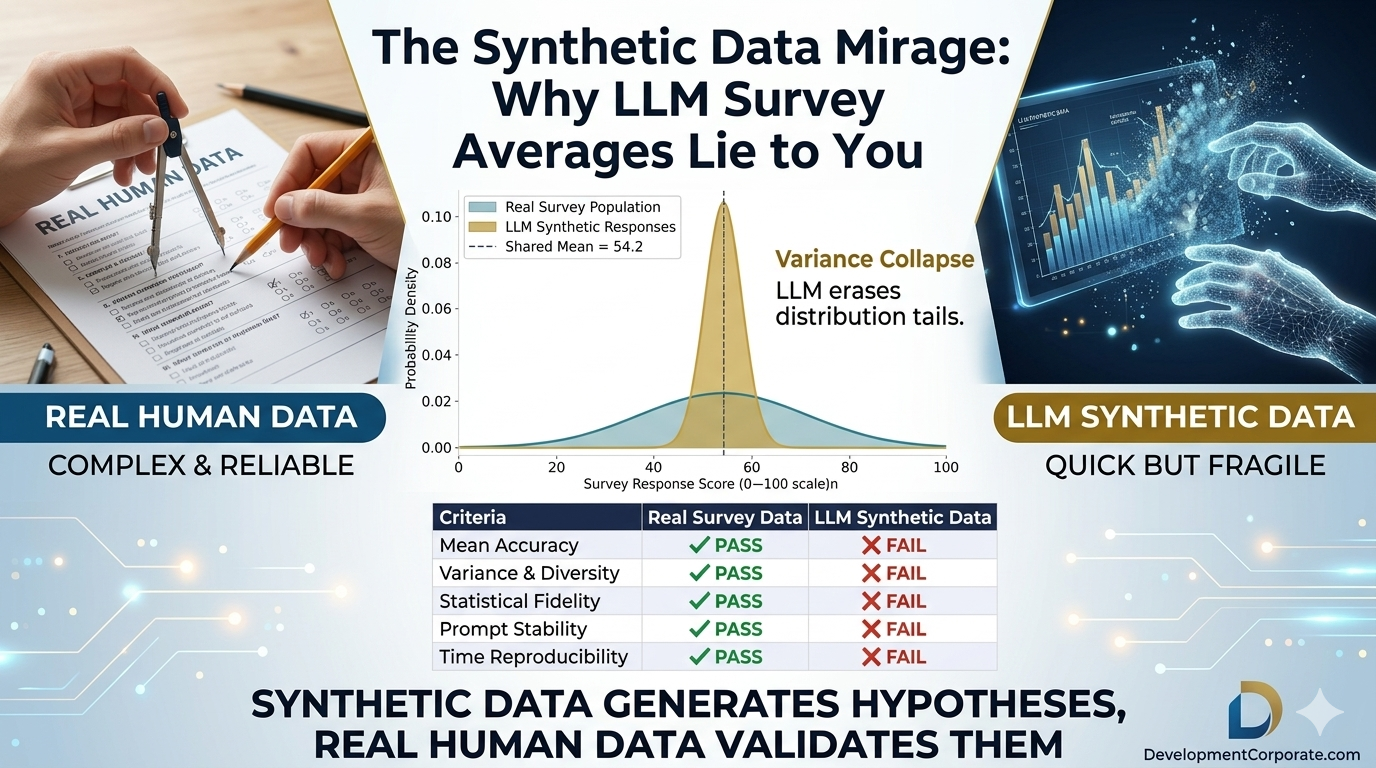
The Synthetic Data Mirage: Why LLM Survey Averages Lie to You
Synthetic data survey research is everywhere in 2026. AI-generated respondents promise instant scale, near-zero cost, and frictionless insights. And here is the terrifying part: they pass your first validation check with flying colors.
That is the mirage.
The same LLM-generated dataset that perfectly replicates your survey’s average score collapses the moment you examine variance, statistical relationships, prompt sensitivity, or reproducibility. Enterprise research teams and product leaders betting decisions on synthetic panels are not getting faster insights. They are building on a foundation that looks solid from 30,000 feet and crumbles on contact with any real analytical pressure.
This post is about the gap between what synthetic data appears to deliver and what it actually produces—backed by the statistical evidence most AI vendors do not want you to examine.
The Efficiency Trap That Makes Synthetic Data So Appealing
Traditional survey research carries a real resource burden. Recruiting human respondents is slow and expensive. Response rates are declining. Timeline pressure in fast-moving product environments is relentless. The math is painful: meaningful sample sizes at the segment level can cost tens of thousands of dollars and take weeks to collect.
Large language models offer an apparent bypass. Feed a demographic persona into an LLM, generate 500 synthetic responses in minutes, and run your analysis. No recruitment friction. Near-zero marginal cost per respondent. Unlimited scale.
The appeal is not irrational. Used correctly—for exploratory hypothesis generation, survey instrument design, and early-stage ideation—LLMs are genuinely useful research tools. We have covered this nuance in our pieces on AI synthetic panels for SaaS research and our analysis of synthetic responses in market research.
⚠ “Useful for exploration” is not the same as “valid for conclusions.” The problem arises when teams skip the human validation step and treat synthetic outputs as production-grade data.
Surface Accuracy: The Seductive First Test
Here is the finding that makes synthetic data genuinely dangerous rather than merely flawed.
When researchers compare top-line averages between LLM-generated responses and real human survey data, the numbers match. In one rigorous benchmark study using the American National Election Studies (ANES) dataset as the gold standard, the human survey mean on a political feeling thermometer came in at 54.2. The LLM synthetic mean: also 54.2.
Perfect agreement. If that is your only validation check, you would declare the synthetic data valid and move forward.

Figure 1: LLM synthetic data passes only one of five scientific research requirements.
This surface accuracy is precisely what creates the trap. It gives researchers a legitimate-looking pass on the simplest test while concealing failures on every test that actually drives decisions.
The benchmark study used demographic persona inputs—age, gender, education, political affiliation—fed into leading LLMs, which then generated synthetic responses to established survey instruments. Researchers compared synthetic distributions to real human distributions across five dimensions: mean accuracy, variance and diversity, statistical fidelity, prompt stability, and time reproducibility.
Synthetic data passed one.
The Variance Collapse: Where Synthetic Data Erases Human Reality
Real human survey populations are messy. They contain strong opinions at both extremes, ambivalent responses in the middle, and everything in between. This diversity is not noise—it is the signal. The tails of a distribution often contain the most strategically significant respondents: the early adopters, the vocal detractors, the niche segments that drive word-of-mouth.
LLMs produce the opposite. When generating responses at scale, they cluster tightly around the central tendency and dramatically compress variance. The distribution collapses into a narrow spike around the mean.

Figure 2: Variance collapse — LLMs erase distribution tails where strategic insight concentrates.
The consequences for enterprise research are severe. If you are running conjoint analysis to understand pricing sensitivity, the respondents who sit at the extreme ends of willingness-to-pay define your ceiling and floor. Synthetic data erases them. If you are segmenting by attitude clusters for product positioning, the distinctive sub-populations that justify distinct GTM motions disappear into the synthetic average.
You end up with a research dataset that looks large and statistically powerful but actually represents a single, blended, artificial perspective wearing multiple demographic costumes.
Carnegie Mellon researchers studying this phenomenon identified what they call “hyper-accuracy distortion”—AI responses are not just less variable, they are suspiciously consistent in a way that real human populations never are. Our analysis of synthetic research threats in enterprise SaaS covers how this pattern corrupts customer insight workflows.
Regression Failure: When Synthetic Data Reverses Reality
Variance collapse is damaging enough. The next finding is worse.
When researchers run regression models on synthetic data—looking for the relationships between variables that drive predictive models, pricing strategies, and segmentation frameworks—the results do not just underperform human benchmarks. They reverse direction entirely.
In the ANES benchmark study, variables that exhibit a clear positive relationship in real human populations show a negative relationship when the same regression is run on LLM-generated data. The predictive direction flips.
Consider what this means in practice. You build a model to predict purchase likelihood from attitude variables. Your synthetic data training set tells you that respondents with attribute A are more likely to convert. Your real-world rollout reveals the opposite. The synthetic data did not just add noise—it gave you a directional error that corrupted your model.
This failure mode is undetectable without a real human benchmark. The model runs cleanly. The R-squared looks acceptable. The coefficients report confidently. And the underlying relationship is backwards.
This is a different category of failure than LLM hallucinations in competitive analysis—where a model fabricates a fact you can catch with a quick search. Regression reversal is structural and silent. It lives inside your model until it fails in production.
The Prompt Instability Problem: Your Instrument Is Broken
Scientific research requires a stable measurement instrument. LLMs have a radically different problem: minor prompt wording changes—not meaningful conceptual shifts, but trivial surface variations—produce entirely different response distributions.

Figure 3: Prompt instability — trivial wording changes produce opposite distribution shapes in LLM synthetic data.
In the benchmark study, researchers fed the same demographic persona two prompts that were functionally identical: “How do you feel?” versus “What is your feeling?” The distributions were not modestly different. They were fundamentally different—opposite in shape, with no stable relationship between them.
This is not question-wording effect. This is instrument fragility. The LLM is not simulating human sensitivity to framing. It is outputting whatever pattern its token prediction machinery associates with a given phrase, and tiny lexical changes cascade into massive distributional shifts.
Two researchers using the same LLM to study the same construct will generate incomparable datasets if their prompt wording differs by even a few tokens. Your synthetic data is not measuring your construct. It is measuring your prompt.
Reproducibility Failure: Science Requires Stability Over Time
Running the identical prompt against the same LLM at different points in time produces different datasets. Not marginally different—fundamentally different in distribution shape, variance, and inter-variable relationships.
Reproducibility is the cornerstone of credible research. If another researcher cannot replicate your findings using your methods, your findings are not findings—they are anecdotes. Peer review, internal audit, and decision accountability all depend on the ability to re-run an analysis and get consistent results.
LLM-generated synthetic data fails this test structurally. Models are updated continuously. Temperature parameters shift. The same prompt run in Q1 and Q3 will produce datasets that cannot be meaningfully compared—which means any longitudinal research built on synthetic panels is measuring model drift, not human attitude change.
The pattern here parallels what we documented in AI hallucination rates as a due diligence risk: LLMs perform confidently and produce outputs that appear authoritative, while the underlying reliability is fundamentally compromised.
The Scorecard: What Synthetic Data Actually Passes
Evaluating LLMs against the five core requirements for scientific survey research produces a clear verdict:
| Criteria | Real Survey Data | LLM Synthetic Data |
|---|---|---|
| Mean Accuracy (Surface averages) | ✔ Pass | ✔ Pass |
| Variance & Diversity (Distribution tails) | ✔ Pass | ✗ Fail |
| Statistical Fidelity (Regression accuracy) | ✔ Pass | ✗ Fail |
| Prompt Stability (Phrasing resistance) | ✔ Pass | ✗ Fail |
| Time Reproducibility (Consistent outputs) | ✔ Pass | ✗ Fail |
Synthetic data passes the test your eyeball validation catches. It fails the tests your downstream models, segmentation frameworks, and predictive analyses depend on.
Where Synthetic Data Actually Belongs in Your Research Stack
The evidence is not an argument against using LLMs in research. It is an argument for using them in their appropriate role—and not as a substitute for the role that only real human data can fill.
Appropriate uses for LLM synthetic data:
- Exploratory ideation — generating hypotheses and stress-testing question wording before a study launches
- Survey instrument design — testing whether questions are clear and checking for leading language
- Example response generation — creating illustrative examples for training materials or scenario planning
Uses that the evidence disqualifies:
- Training predictive models on synthetic respondent behavior
- Validating pricing strategy or willingness-to-pay estimates
- Sizing market segments or defining addressable opportunity
- Making product roadmap prioritization decisions
The validation framework we have outlined in our synthetic data validation protocols operationalizes this boundary: synthetic data generates the hypothesis, human data validates it. Skip the validation step and you are not doing faster research—you are doing fictional research at high velocity.
The ethical and bias dimensions of synthetic research add a further constraint: LLMs systematically underrepresent non-Western, non-English-speaking perspectives. For enterprise teams with global markets, the synthetic sample is not just statistically compromised—it is geographically and culturally biased toward the populations most represented in LLM training data.
The Diagnostic Question Your Research Team Should Be Asking
If your organization is currently using LLM-generated synthetic data in research workflows, the key diagnostic question is not “does our synthetic data look reasonable?” It is “at what point does our synthetic data connect to a real human validation step?”
If the answer is “never,” your decision pipeline is running on the statistical equivalent of a reflection of reality—one that matches at the surface and diverges at depth.
The surface accuracy is not reassuring. It is the tell. An instrument that fails only on variance, regression relationships, prompt stability, and reproducibility is an instrument that fails precisely where the analytical work that matters actually happens.
Conclusion: The Mean Is Not the Message
LLMs can produce synthetic survey data that matches human averages exactly. This is the finding that makes synthetic data genuinely dangerous—it passes the first validation test, generates false confidence, and conceals four categories of structural failure that do not surface until your model is in production.
Variance collapse erases the distribution tails where strategic insight concentrates. Regression reversal corrupts the directional relationships your predictive models depend on. Prompt instability means you are measuring your instrument, not your construct. Non-reproducibility means your findings cannot be independently verified or replicated over time.
The right framework treats synthetic data as hypothesis infrastructure—fast, cheap, and appropriate for exploration. Real human data remains the validation layer. The teams that confuse these two roles are not moving faster. They are generating conclusions that look like insights and perform like errors.