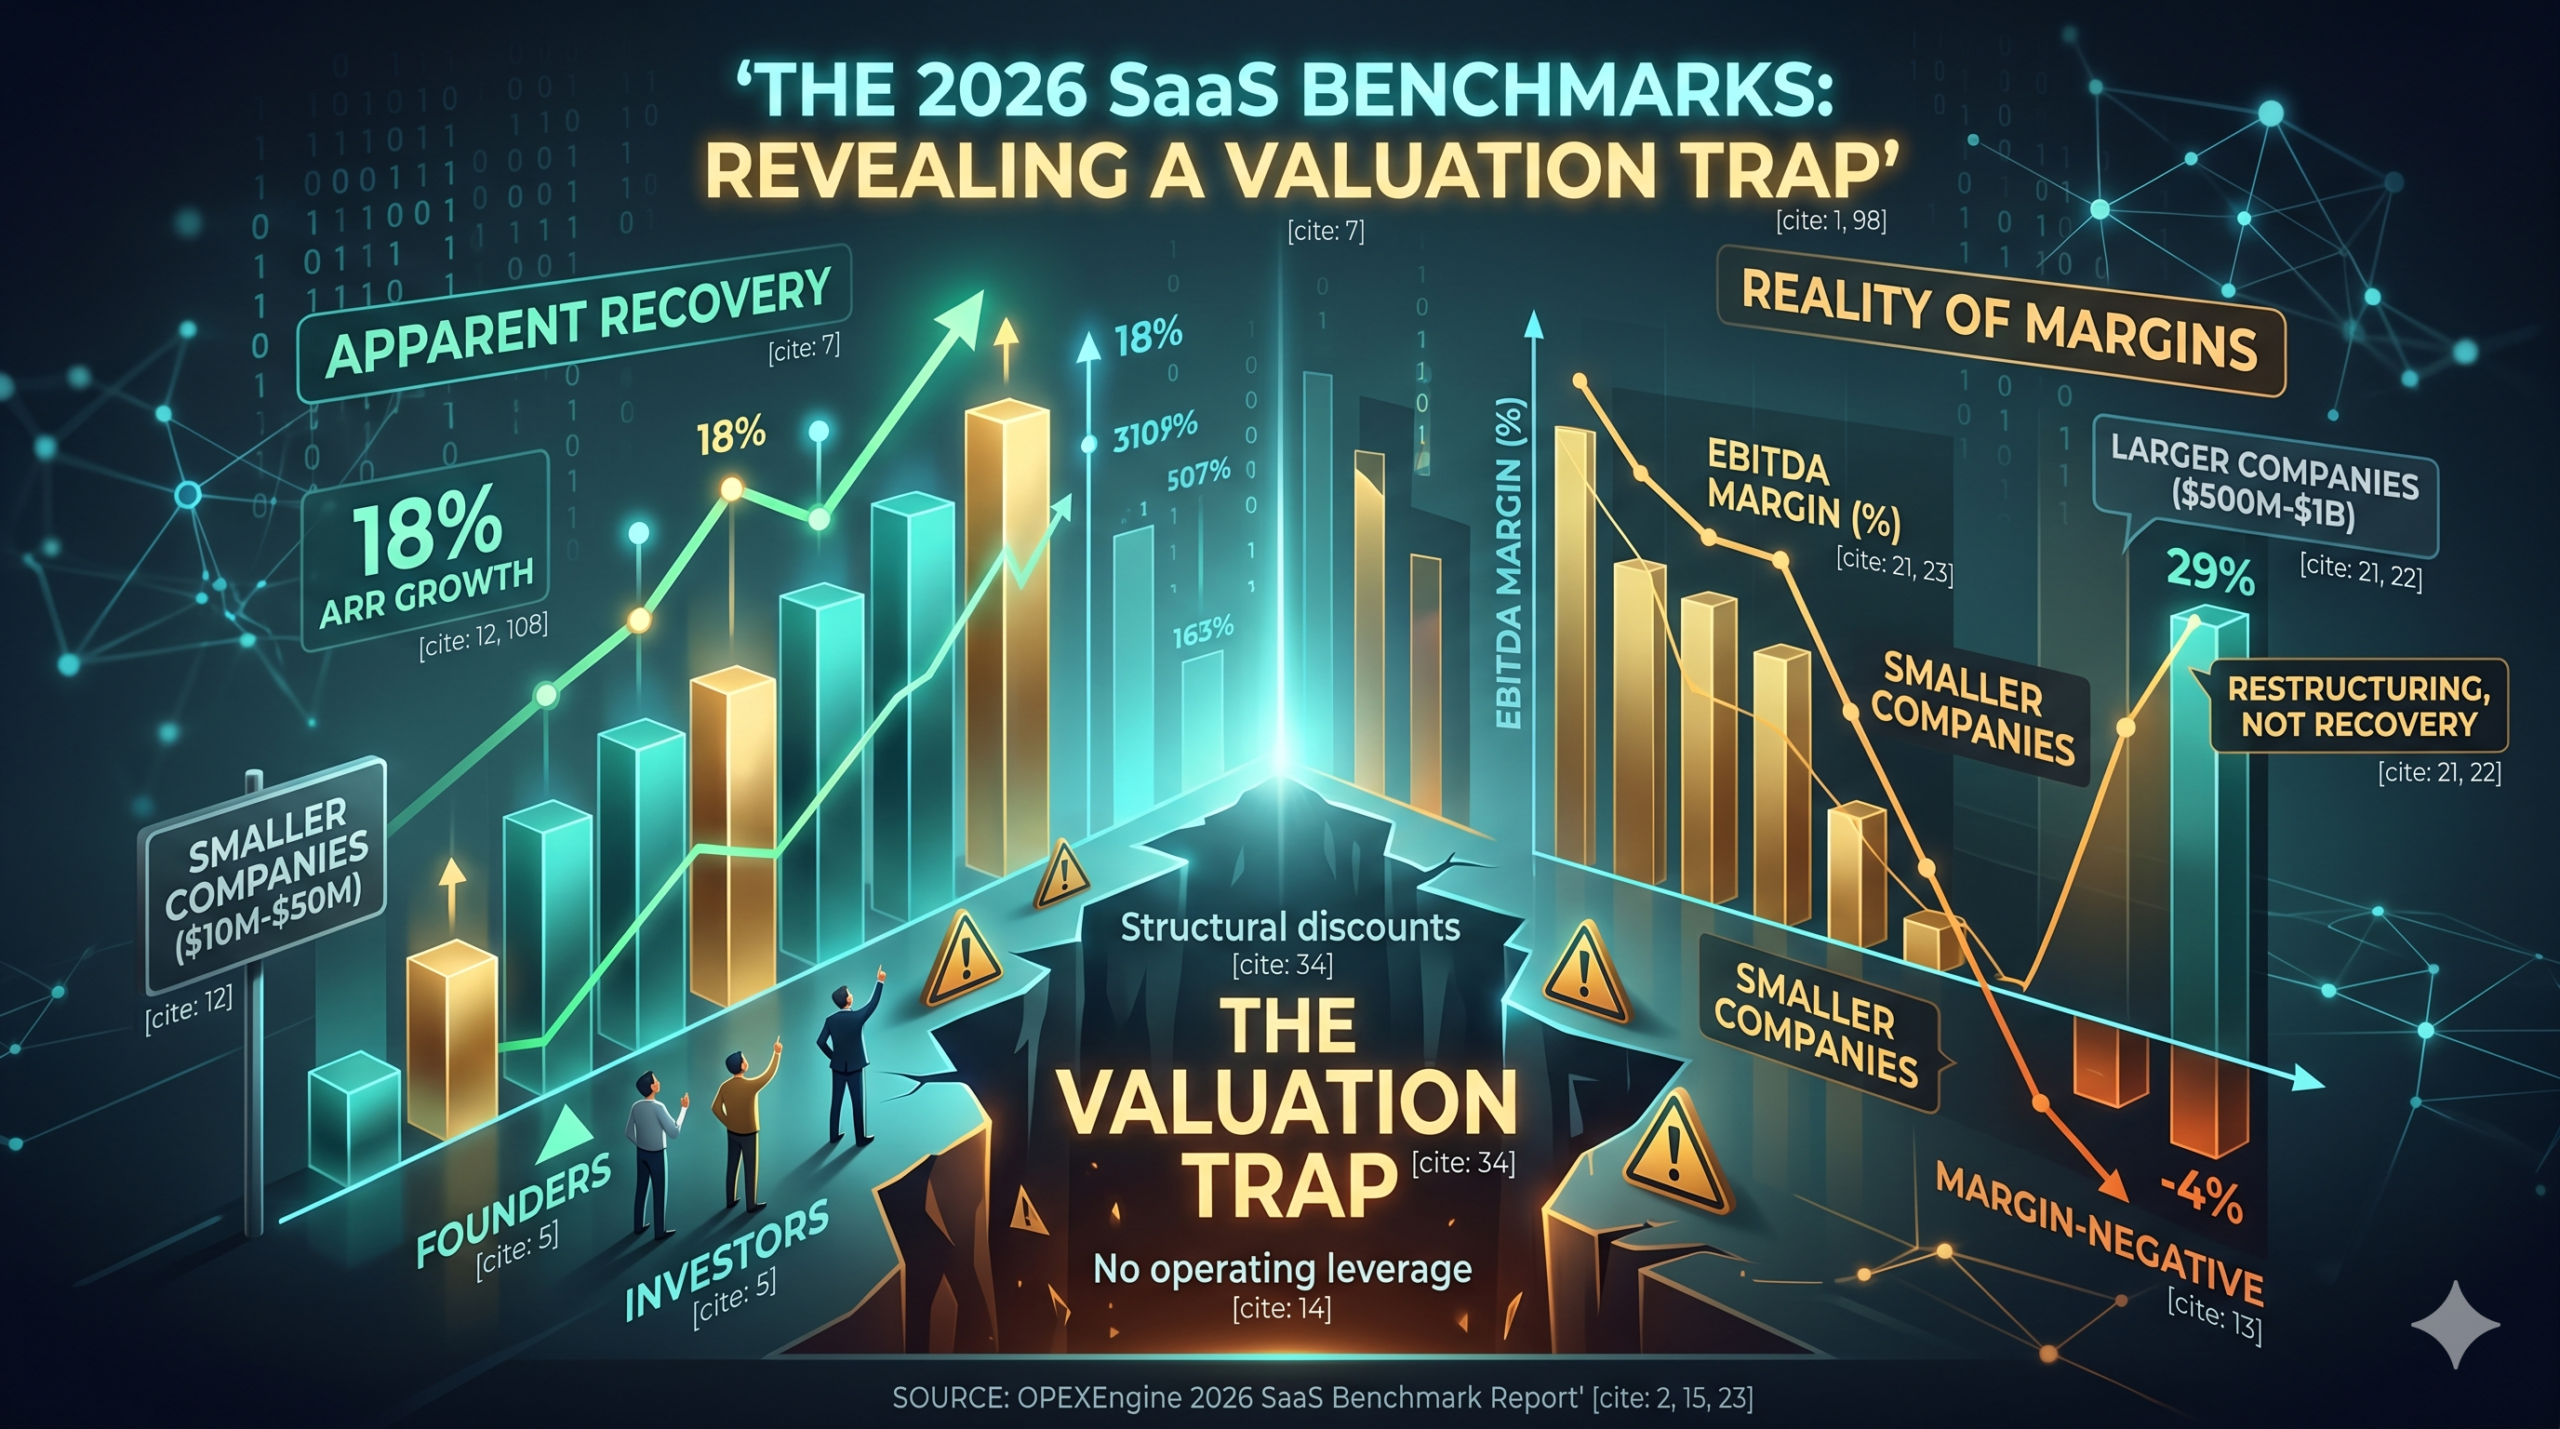
The 2026 SaaS Benchmarks Reveal a Valuation Trap — Not Just a Recovery
Source: OPEXEngine 2026 SaaS Benchmark Report
The 2026 SaaS benchmarks are generating optimistic headlines. Smaller companies are growing again. Larger companies are posting EBITDA margins that would have seemed unthinkable in 2022. The mainstream take: SaaS is recovering.
The M&A reality is more complicated — and for most founders and investors, significantly more dangerous. OPEXEngine’s proprietary benchmark data, drawn from 250+ SaaS operational and financial metrics across private company submissions, reveals a market that is not recovering uniformly. It is bifurcating. And in a bifurcated market, the wrong benchmark comparison leads to the wrong valuation conclusion — which leads to mispriced exits, overpaid acquisitions, and busted deal timelines.
This analysis unpacks what the OPEXEngine 2026 data actually says — and translates it into acquisition strategy, exit timing, and due diligence implications that the press release version of this story leaves out.
Two Recoveries, Not One: The Core Story in the 2026 SaaS Benchmarks
OPEXEngine’s data describes two distinct market dynamics operating simultaneously — and conflating them is the primary source of valuation error in today’s SaaS M&A market.
Smaller Companies: Growth Rebounds, Margin Stays Negative
The $10M–$50M revenue cohort returned to 18% ARR growth in 2025 — matching 2023 levels after dropping to 13% in 2024. The $50M–$100M cohort improved from 12% to 14%. These are meaningful numbers. But the profitability picture tells a different story: the $10M–$50M cohort maintained an EBITDA margin of approximately -4%, while the $50M–$100M cohort improved only from -1% to 1%. These companies are growing again — but they are not yet generating the operating leverage that justifies premium acquisition multiples.

Figure 1: ARR growth rates by revenue cohort, 2024 vs. 2025. Source: OPEXEngine 2026 SaaS Benchmark Report / DevelopmentCorporate analysis.
Larger Companies: Margin Expands, Growth Continues to Slow
For companies above $100M, the dynamic inverts. The $100M–$500M cohort saw ARR growth decline from 13% in 2024 to 11% in 2025 — continuing a three-year deceleration from 17% in 2023. Yet EBITDA margin expanded sharply: from 8% to 14%. The $500M–$1B cohort posted an even more dramatic margin expansion, from 17% to 29% EBITDA, in a single year.
This is not a recovery story. This is a restructuring story. These companies are finding operating leverage by reducing headcount, disciplining spend, and harvesting existing ARR bases — not by accelerating new revenue growth.
The $500M–$1B cohort improved EBITDA margin from 17% to 29% in a single year. That is not a recovery — that is a cost restructuring that happens to look like one.

Figure 2: EBITDA margin expansion by revenue cohort, 2024 vs. 2025. Source: OPEXEngine 2026 SaaS Benchmark Report / DevelopmentCorporate analysis.
The Rule of 40 Reality: Where the 2026 SaaS Benchmark Cohorts Actually Stand
The Rule of 40 — which combines ARR growth rate plus EBITDA margin — remains the standard single metric for assessing SaaS health from an investor or acquirer perspective. A score above 40 signals a company that has achieved genuine balance between growth efficiency and profitability. Mapping the OPEXEngine cohorts onto Rule of 40 produces a sobering picture.

Figure 3: Growth vs. profitability positioning by revenue cohort (2025). The Rule of 40 threshold line shows no OPEXEngine cohort currently meets the benchmark. Source: OPEXEngine / DevelopmentCorporate analysis.
The math: the $10M–$50M cohort scores roughly 14 (18% growth minus 4% EBITDA). The $50M–$100M cohort scores 15. The $100M–$500M cohort scores 25. Even the best-performing cohort in the OPEXEngine data — the $500M–$1B segment — likely sits in the high-30s at best. No cohort currently clears the Rule of 40 threshold.
This matters enormously for M&A pricing. As we documented in our analysis of SaaS ARR-based lending collapse, private credit underwriters and equity buyers are now applying virtually identical scrutiny to growth quality and margin trajectory. Companies with Rule of 40 scores below 30 are receiving structural discounts — regardless of their ARR headline.
2026 SaaS Benchmark Implications for M&A Valuation and Exit Timing
The bifurcated benchmark picture creates distinct implications depending on company size — and distinct traps for buyers and sellers who apply the wrong peer group to their analysis.
The Small-Company Trap: Growth Without Profitability Does Not Justify Premium Multiples
The rebound in sub-$100M growth is real. But it is not yet accompanied by profitability improvement. A company growing at 18% with -4% EBITDA is not on the same valuation trajectory as a company growing at 18% with 10% EBITDA. The absence of margin improvement in the growth-recovery cohorts means that buyers cannot yet validate the underlying business model efficiency that higher multiples require.
Founders who interpret the growth rebound as a green light for 2026 exit processes may encounter a painful reality: acquirers are looking at ARR multiples through an EBITDA-adjusted lens. As our SaaS Exit Crisis analysis documented, PE buyers now require EBITDA-positive profiles before applying premium multiples — and the 2026 OPEXEngine data confirms the smaller cohorts have not yet reached that threshold.
The Large-Company Trap: Margin Expansion Is Not the Same as Value Creation
The $500M–$1B cohort’s leap from 17% to 29% EBITDA looks impressive in a benchmark table. In an M&A model, it requires more careful interpretation. Rapid margin expansion driven by expense discipline — rather than by revenue leverage — often signals that growth has been sacrificed to fund margin. Buyers underwriting at EBITDA multiples still need to assess what the growth trajectory looks like going forward.
The Q3 2025 Enterprise SaaS M&A data showed that megadeals commanded premium multiples specifically because they combined both dimensions — meaningful margin and credible growth runway. The OPEXEngine cohort data suggests that most mid-market private SaaS companies have improved only one of the two, not both.
Net Revenue Retention: The Benchmark Metric the OPEXEngine Data Does Not Directly Cover
One important caveat in applying the OPEXEngine cohort benchmarks to M&A analysis: the data covers revenue growth and EBITDA, but the quality of growth — specifically net revenue retention (NRR) — is not directly addressed. NRR above 110% produces fundamentally different valuation outcomes than growth driven purely by new logo acquisition at the same headline percentage. Buyers performing rigorous due diligence will decompose the growth rebound into new-logo contribution vs. expansion contribution before applying multiples.
Why Smaller Companies Are Recovering First — And Why It May Not Last
OPEXEngine’s own analysis points to operational agility as the driver of the sub-$100M growth rebound: smaller companies can reprice, shift sales motions, and adopt AI workflows without the coordination overhead of larger organizations. This is consistent with the broader seed-stage market dynamics Carta documented in late 2025, where solo founders and lean teams were outperforming larger cohorts on growth efficiency.
The risk is that agility-driven growth is harder to sustain as the company scales. The transition from $30M to $100M ARR typically requires process formalization, sales org investment, and customer success infrastructure — all of which compress margin. A company that is currently growing at 18% with -4% EBITDA needs to add significant revenue before it can begin converting growth into margin. Buyers who underwrite today’s growth rate into a forward EBITDA model without accounting for this transition cost are making a structural error.
For a framework on how these financial dynamics compound across the growth lifecycle, our SaaS financial literacy guide provides a detailed walkthrough of deferred revenue, EBITDA timing, and the unit economics that determine whether growth translates into value.
The Public Company Signal: Moderation Is Decelerating, Not Reversing
The BVP Nasdaq Emerging Cloud Index — a reliable public-market benchmark for larger SaaS companies — confirms the private data directionally. The $1B–$5B cohort grew 18% in 2025, down from 22% in 2024. Companies above $5B grew 16%, down from 17%. The deceleration rate is shrinking: both cohorts dropped only 1–4 percentage points in 2025, compared to sharper declines in 2023–2024.
The conventional read: the market is stabilizing. The M&A read: public company multiples already reflect this stabilization narrative. If you are planning a 2026 or 2027 exit, the multiple expansion opportunity from public market sentiment improvement has likely already been partially priced in. The incremental argument for premium valuation needs to come from company-specific fundamentals — not from market tailwinds.
This mirrors what our 2023 SaaS M&A review identified as a persistent pattern: high-quality assets command premiums regardless of market conditions, while median-quality assets suffer disproportionately when sentiment shifts.
A Note on AI’s Role in the 2026 Benchmark Picture
The OPEXEngine data does not directly address AI adoption’s contribution to the benchmarks. But it is implausible to discuss 2025–2026 SaaS operating metrics without acknowledging AI’s dual role: as a margin enabler (through automation of support, engineering, and back-office functions) and as a product-layer disruption risk (for companies whose core workflows are being absorbed by AI-native alternatives).
The margin expansion in the $500M–$1B cohort is at least partially attributable to AI-driven headcount efficiency. But M&A buyers are also scrutinizing whether AI adoption inside target companies creates reliability risks that the benchmark data doesn’t capture. Our AI hallucination rates as a due diligence crisis analysis documented how AI-enabled efficiency claims are increasingly being challenged during diligence — and how companies that cannot produce independently validated AI reliability data are facing valuation haircuts.
| FOR PE/VC INVESTORS |
| Benchmark your portfolio companies against the correct revenue cohort — the gap between $30M and $300M ARR behavior is now wider than at any point since 2021.The $500M–$1B EBITDA improvement (17% to 29%) is impressive, but verify whether it reflects genuine operating leverage or one-time expense actions that will not recur.Smaller portfolio companies showing growth recovery but negative EBITDA (-4% at the $10M–$50M level) are not yet M&A-ready at premium multiples — plan for 12–18 more months of margin improvement before exit processes.Apply Rule of 40 scoring to every hold-company review. No OPEXEngine private cohort currently clears 40. Companies that are approaching 30+ are differentiated; those below 20 face structural multiple discounts.NRR decomposition is non-negotiable in 2026 diligence. The growth rebound in smaller cohorts may reflect new logo recovery rather than base expansion — which implies significantly higher customer acquisition costs and lower multiple justification. |
| FOR SAAS FOUNDERS APPROACHING EXIT |
| The growth rebound in your cohort is real but insufficient for premium exit multiples if you remain margin-negative. Buyers at 6-8x ARR want to see a credible path to 10%+ EBITDA within 24 months of close.Do not benchmark against companies in different revenue cohorts. A 14% growth rate means something very different at $40M ARR vs. $400M ARR. Use peer-appropriate comparisons in your CIM.The Rule of 40 is now a standard gating metric in PE term sheets. If your combined growth + EBITDA score is below 25, price accordingly and build a compelling operational improvement story.AI-driven efficiency claims need independent validation before diligence. Buyers who have read about AI hallucination risks are asking pointed questions about production reliability. Companies with documented, validated AI performance data negotiate from strength.If your NRR is below 100%, the growth rebound means you are running to stand still — replacing churned revenue rather than compounding existing ARR. Fix NRR before marketing a sale process. |
| FOR ENTERPRISE CTOs & CPOs |
| The 2026 benchmark data validates the efficiency-through-AI thesis for larger organizations. The $500M–$1B cohort’s EBITDA jump from 17% to 29% is consistent with organizations that have successfully deployed AI across engineering, support, and back-office workflows.But margin improvement through headcount reduction creates a technical debt risk that benchmark data does not capture. Evaluate whether your efficiency gains are sustainable or represent deferred platform investment.Smaller SaaS vendors in your stack (sub-$50M ARR, -4% EBITDA) are increasingly acquisition targets — or failure risks. Build supplier risk assessment into your vendor governance framework for vendors in the growth-but-margin-negative zone.The growth rebound in smaller SaaS companies is partly AI-driven: smaller organizations moved faster on AI adoption. As you evaluate build-vs.-buy decisions, the benchmark data suggests the capability gap between agile small vendors and large incumbents may be widening temporarily. |
What to Watch in H2 2026: Three Inflection Points
1. Whether Margin Recovery Reaches the Sub-$100M Cohorts
The most important signal to watch is whether the growth recovery in smaller companies translates into EBITDA improvement by year-end. If the $10M–$50M cohort can move from -4% toward 0% EBITDA while maintaining 15%+ growth, the M&A valuation case strengthens materially. If margin stays flat or deteriorates, the growth rebound is a false signal for exit timing.
2. Whether Large-Company Growth Stabilizes or Continues to Decline
The $100M–$500M cohort dropped from 17% growth in 2023 to 11% in 2025. If the deceleration continues to 8–9% in 2026, the EBITDA margin story stops compensating. Acquirers underwriting at current multiples need at least some evidence of growth floor before committing to deals at scale.
3. Whether AI Efficiency Gains Prove Durable
The EBITDA expansion across all cohorts has an AI fingerprint. As AI infrastructure costs normalize and the initial wave of headcount reduction runs its course, the question is whether these efficiency gains compound — or whether they were one-time events. The next benchmark cycle will provide the first reliable data on this question.
Bottom Line: The 2026 SaaS Benchmarks Are a Starting Point, Not a Verdict
OPEXEngine’s 2026 data is rigorous, valuable, and — for M&A practitioners — more nuanced than the recovery narrative suggests. The key analytical principle is simple: benchmark comparison is only useful when the peer group is correct. A $30M SaaS company that grew from 13% to 18% ARR is operating in a completely different market dynamic than a $400M company that held growth at 11% while expanding EBITDA by 6 points. Both are outperforming peers who moved in neither direction. Neither is ready for the same valuation conversation.
The companies that will capture the best outcomes in 2026 — whether as acquirers, sellers, or portfolio operators — are those that use the benchmark data to identify their specific position in the bifurcation, and build their strategy accordingly. The recovery is real. But it is not uniform, it is not yet reflected in Rule of 40 performance, and it does not yet justify 2021-era exit assumptions.
The trap is not in the data. It is in treating a partial recovery as a complete one.