Bessemer Ventures Research: Scaling to $100 Million
The definitive benchmarking report on how cloud companies grow operationally efficient businesses and scale to $100 million in ARR (and beyond).
Bessemer Ventures is one of the leading venture capitalist firms in the country. They are a $4B venture capital firm that funds seed stage to growth. They’ve made over 1,587 investments and ha 396 exits. funded the early stages of [Pinterest, Blue Apron, Skype, Skybox Imaging, Twitch, and Periscope and helped build 117 IPOs including Twilio, Yelp, LinkedIn, Shopify, and Wix. They recently published a great report Scaling to $100 Million that provinces detailed metrics about ARR, Growth, Retention, Gross Margins, CAC Paybacks, Free Cash Flow, and Valuations from over 200 of their cloud investments. The data analyzes firm performance by ARR revenue tier from $1 million to $100 million. Data like this on private SaaS companies are extremely hard to come by. This report is a treasure trove. This post contains excerpts from the study. You can access the entire report here.
ARR Growth Rates

“Examining Bessemer’s cloud portfolio over the last decade, we find that the expected growth rate for companies decreases over time, as it is easier to grow at a higher rate on a smaller base of revenue and the marginal dollar is always harder to acquire. The average growth rate for companies between $1-10MM of ARR was nearly 200%, and this average decreases to 60% for companies over $50MM of ARR. We also find that the middle 50% of cloud companies have a tighter and tighter band of growth rates as ARR scale increases: the middle 50% of companies from $1-10MM of ARR are growing from 100-230% while the middle 50% of companies from $50MM+ of ARR are growing from 35-80%.”
Growth Endurance

“While we know the average growth rate for a cloud company tends to decrease over time, as investors we are often tasked with modeling out the future growth of a company based on imperfect information. A helpful heuristic that we like to use is the idea of Growth Endurance, which we explored in this year’s State of the Cloud 2021. Growth Endurance is the rate at which growth is retained from one year to the next, which tends to be very consistent in cloud companies. As the analysis below shows, when we plot the percentage of ARR Growth lost between each year, we find that it decays at a fairly predictable 30%. As a private cloud company, you should expect next year’s growth rate for your business to be ~70% of the current year.”
Gross and Net Retention

“Cutting the data by industry rather than ARR range, we find that gross retention largely hovers in a similar range but net retention varies much more across industries. Developer tools have the greatest average and median net retention rates across our portfolio, in line with what we would expect from a bottoms-up sales strategy that expands seat count and usage as it permeates an org. Collaboration software shows a similar dynamic. Though there are exceptions, industries such as sales and marketing software, customer experience software, and finance / legal tech tend to have lower net retention, likely because land ACVs are higher and expansion over time is lower (often these tools sell a complete platform, rather than individual seats or usage tiers).”
Gross Margin

“The beauty of software is that there is practically $0 marginal cost to replicate and distribute it. Gross margin, a company’s revenue after the cost of goods sold (or gross profit) divided by revenue, is an incredibly important metric for cloud companies because it measures the effectiveness with which companies can deliver their software to their customers. The aim is to make it as high as possible, reflecting the lowest marginal cost. A high gross margin means that a cloud company can invest more into operating expenses rather than product delivery, leading to more selling, product iteration, and ultimately, growth. Typical expenses that you will find in COGS for cloud companies are hosting costs, software implementation costs, and services costs, including customer success—these are all variable costs.
Given that the marginal cost for delivering software should be very low, investors expect gross margins for cloud companies to stay within a fairly tight band. It is perhaps the only operating or cost metric that has very little wiggle room—the average gross margin for a cloud business regardless of maturity is 65-70%, and the distribution of the middle 50% stays within ~60-80%.”
Operating Expenses

“Sales and marketing expense (S&M), which is the most important operating expense for cloud investors and founders to pay attention to. Sales and marketing expense is the income statement line item that captures sales expenses, sales compensation, content and brand marketing, demand generation, and customer success expenses related to sales, among other costs. This represents the highest cost centers in cloud companies, representing over 50% of the total revenues brought in every year, even at maturity, as salespeople and marketing talent scale more linearly with revenue growth.”
CAC Payback

“While we present the averages across Bessemer’s cloud portfolio, CAC paybacks can range materially, generally due to customer segment. For cloud companies selling into SMB-focused accounts, you should target CAC payback <12 months; for mid-market-focused accounts, target CAC payback <18 months; and for enterprise-focused accounts, target <24 months. The three-segment buckets tend to have different annual contract values (SMB the smallest, enterprise the highest) and churn rates (enterprise the lowest, SMB the highest), allowing enterprise-focused companies to support longer payback periods than SMB-focused ones. Put another way, enterprise segments tend to have long lifetimes and therefore high CLTVs and SMB short lifetimes and therefore lower CLTVs, thereby supporting significantly different customer acquisition cost structures.”
Free Cash Flow Margin

Free cash flow (FCF) represents the cash that your company generates, or loses, after netting out its COGS, operating, and capital expenses, and adding back non-cash expenses. The reason FCF is so important is that in cases in which businesses are consuming capital—they are burning cash—free cash flow limits the amount of runway that a company has without accessing the capital markets. For cases in which businesses are generating cash, free cash flow is capital that can be either reinvested in the business to catalyze additional growth or doled out to shareholders as returns. Free cash flow determines profitability. As such, FCF margin, which is the measure of cash flow divided by revenue, is a core cloud KPI. As investors, we want to ensure that as a business consumes money for product, go-to-market, and administrative needs, it is doing so prudently.”
Cash Conversion Score

“The Cash Conversion Score (CCS) is another metric that we often use to evaluate whether or not the capital that cloud companies raise and consume is generating a meaningful return. As the ratio of the ARR to total capital invested into a company minus cash, the Cash Conversion Score is effectively the return-on-investment of each dollar ever invested into a company. For both founders and investors, the Cash Conversion Score is, therefore, a powerful proxy for returns. If a company has a CCS of 1.0x, one dollar of investment into the business yields one dollar of topline recurring revenue. If we assume that the average cloud company gets a 10x revenue multiple (more in-line with historical norms vs. the 23x revenue multiple of ^EMCLOUD today), the one dollar of revenue multiplied by the 10x multiple equals $10 of enterprise value. Every dollar put into the company is getting a 10x return. Similarly, a company with a 0.1x CCS would only return the capital invested. ROI is not driven by Cash Conversion Score directly, but CCS indicates multi-year trends in a couple of incredibly important things, including product-market fit and a scalable sales and marketing organization. It is therefore a core KPI we track in evaluating cloud businesses”
Valuation Multiples


For cloud founders and executives looking to fundraise from VCs, understanding what multiple they will get is one of the biggest unknowns. In cloud, it is almost always a function of one thing: growth. In the private markets, investors are generally willing to pay ahead of ARR acquisition, betting on the company’s ability to “grow into” its valuation—but the higher the growth, the faster it “grows into” that number. For example, If a company is growing at 300% YoY, a 40x valuation multiple will become a 10x valuation multiple in just one year. As a consequence, the general rule is that higher growth rates command higher multiples. As growth rates steadily go down across ARR buckets, we therefore generally see that later stage companies raise at lower valuation multiples—and when they are still able to grow 100% at scale, they command premium valuations.
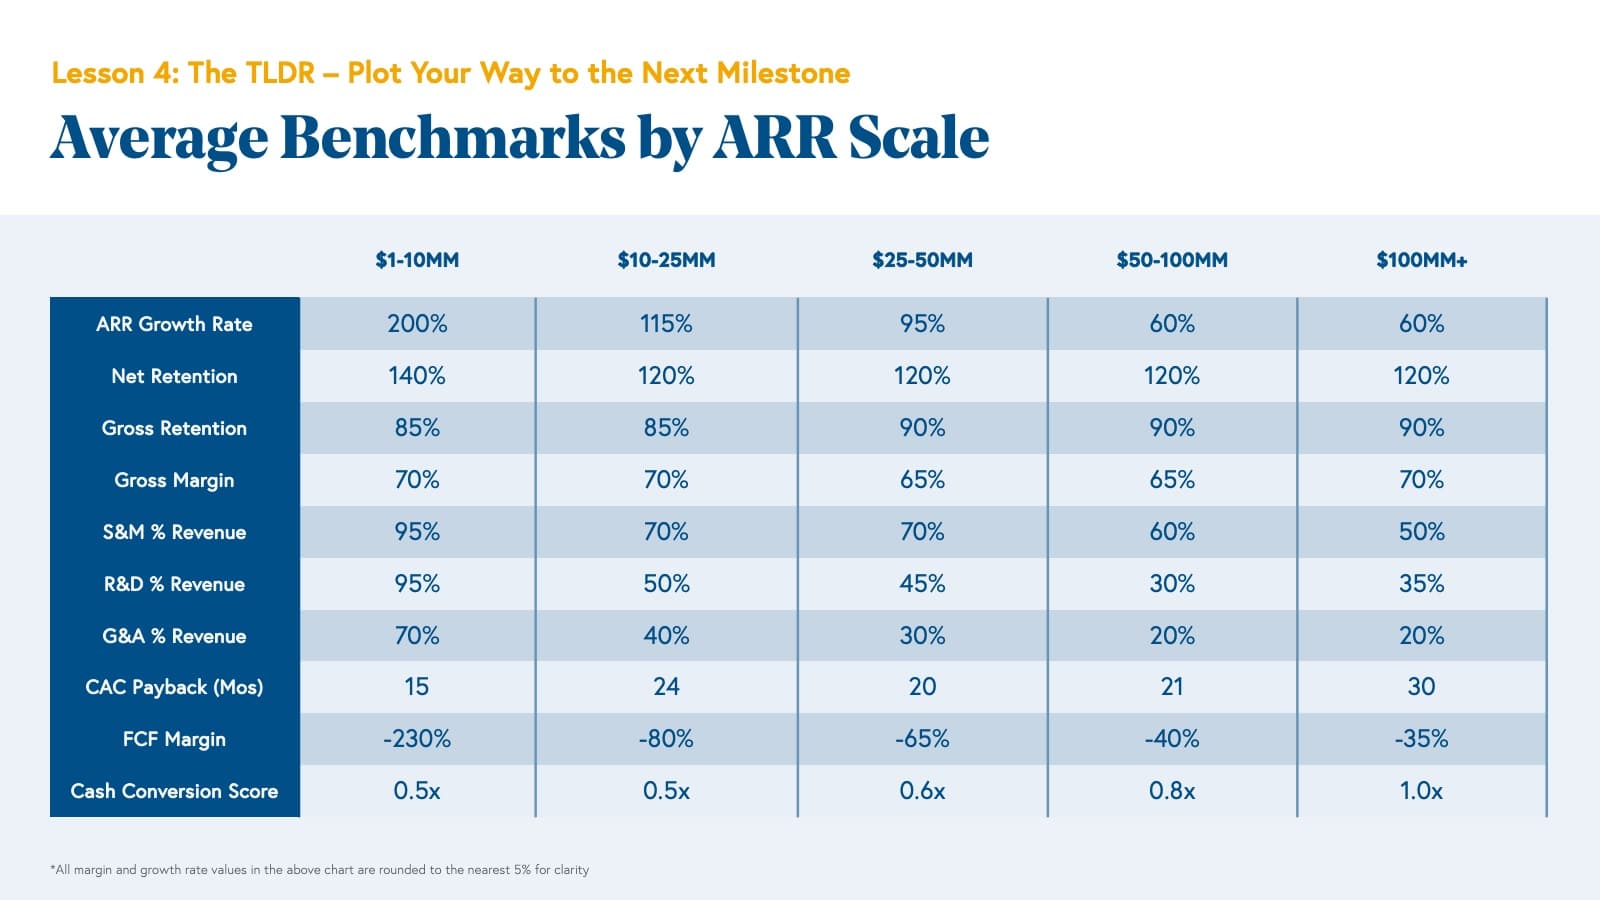
Average Benchmarks by ARR Scale