
The Software Equity Group (SEG) regularly publishes quantitative research on the software and SaaS market M&A activity. It is always great information and clearly shows the trends in the industry. While information providers like PitchBook and dealroom offer comprehensive data and analysis, they are paid services that cost thousands of dollars a year. SEG offers its research for free.
SEG publishes two major updates every quarter — one on the overall software market (on-premise & SaaS). The other is the SEG SaaS Public Market Update. The SEG SaaS Index contains dozens of publicly traded SaaS companies. The SaaS-only market has dramatically different performance than the overall market that also includes on-premise software. You can download the Q3 2021 SaaS Public Market Update here. You can download Q3 2021 SaaS M&A Update here.
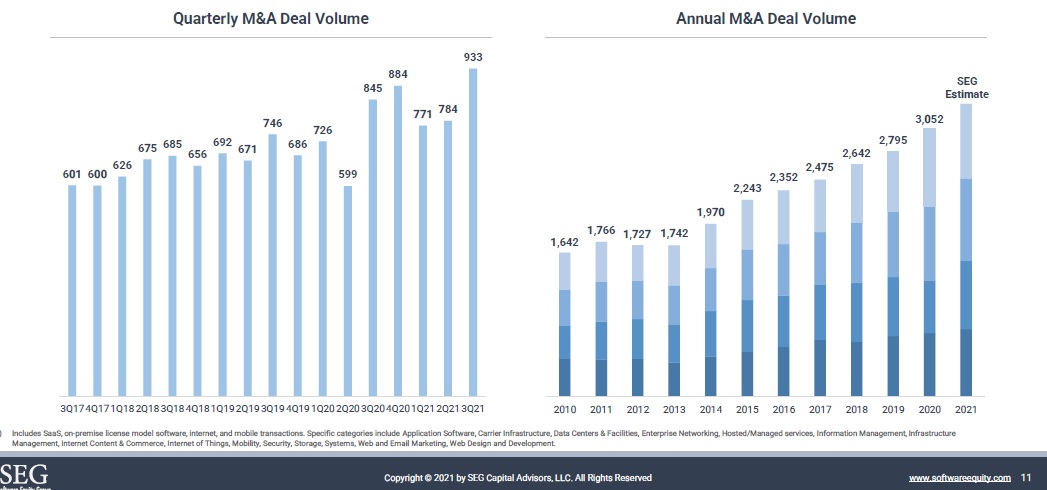
SaaS M&A Transaction Volume Hits a New High
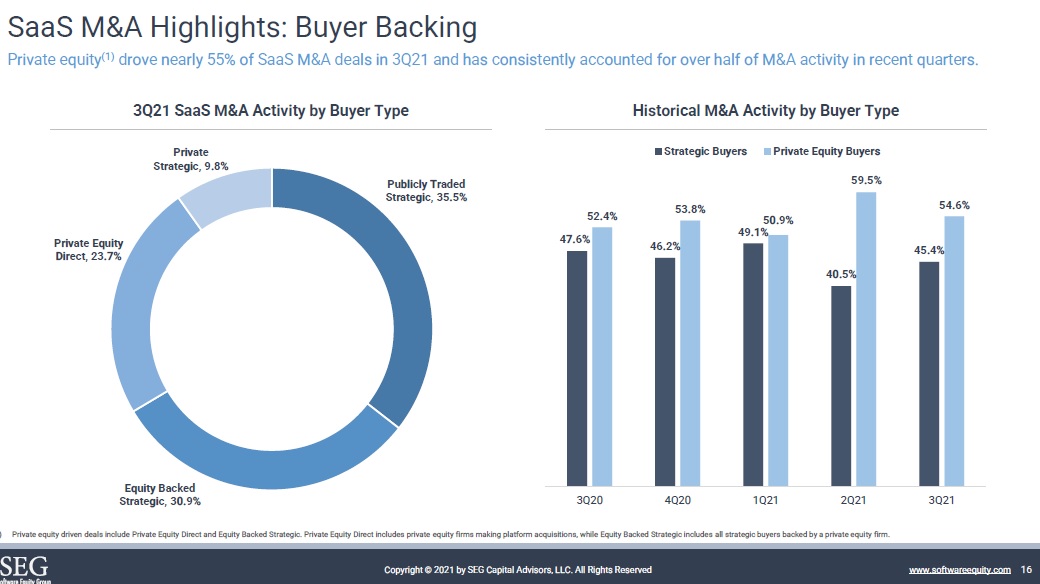
Private Equity Continues to Dominate SaaS M&A Deal Volume
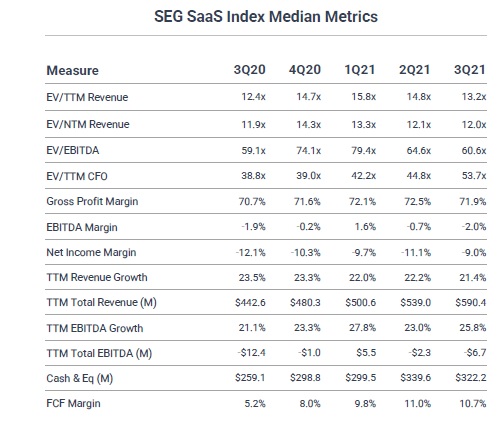
Median Enterprise Value/Revenue (ttm) Declines 10.8%
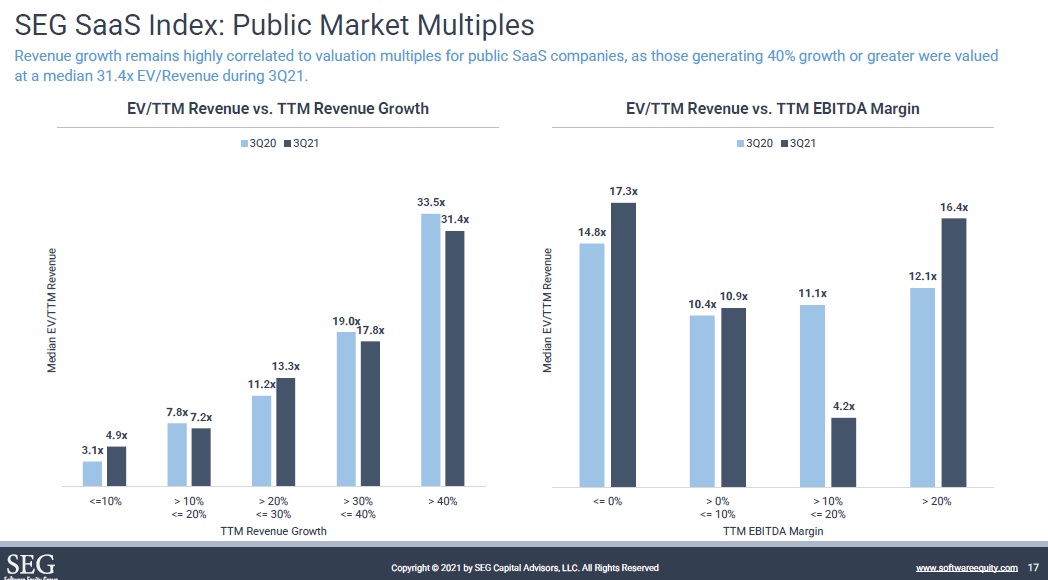
High Revenue Growth SaaS Command Significant Premium over Low Growth
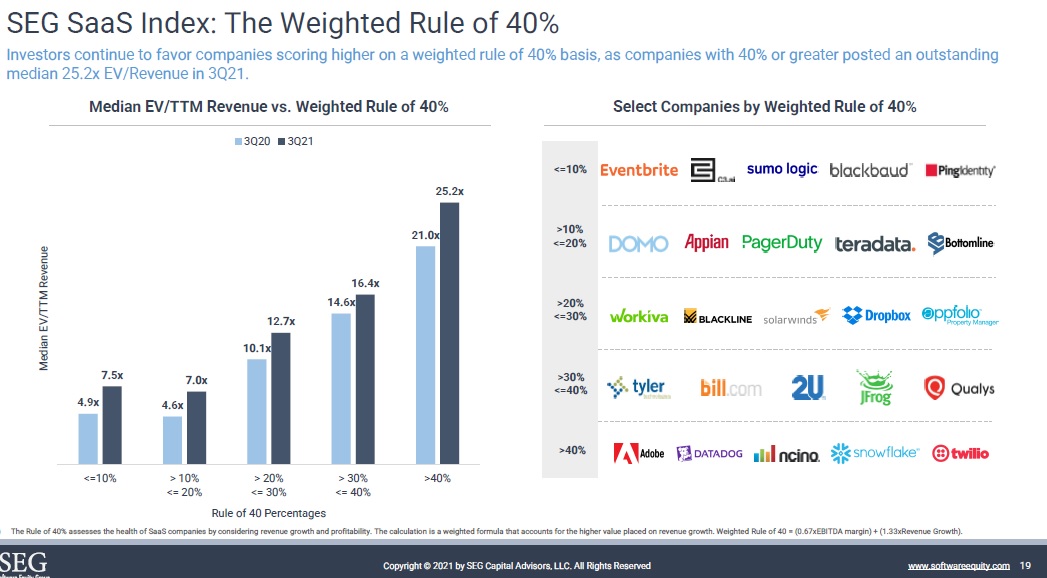
High Valuations for Rule of 40 Enterprises
The Rule of 40 is a common metric used by private equity investors and strategic buyers to measure the performance of SaaS companies. Measuring the trade-off between profitability and growth, the Rule of 40 asserts that a successful SaaS company’s growth rate and profit margin should add up to 40% or more.
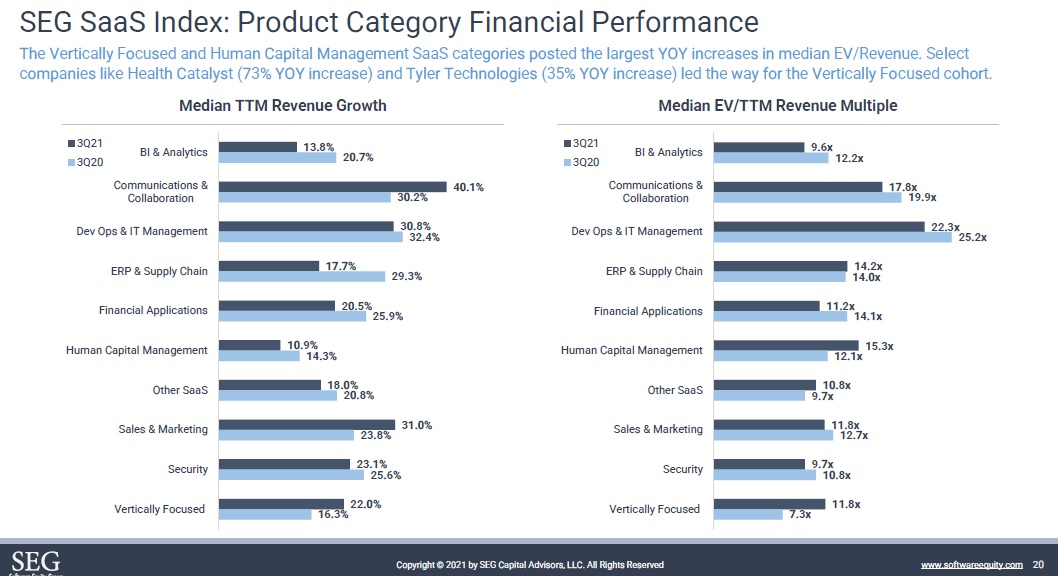
Some SaaS Categories Are Significantly More Valuable Than Others
Dev Ops & I.T. Management is the highest valued category (25.2x EV/Revenue). Vertically Focused (7.3x) and Other SaaS (9.7x) is the lowest.
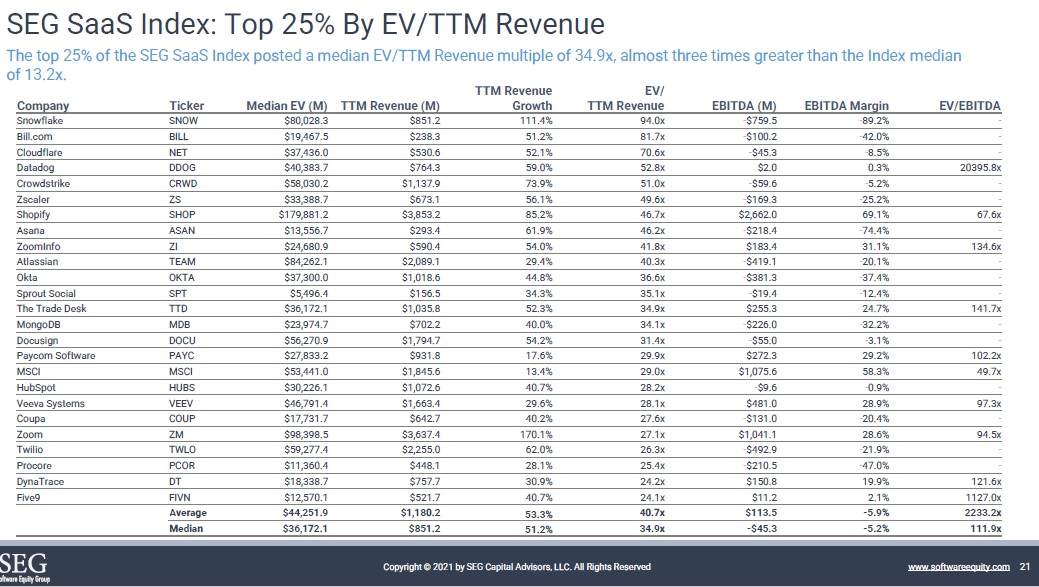
Top 25% in SEG SaaS Index
The top 25% of the SEG SaaS Index posted a median EV/TTM Revenue multiple of 34.9x, almost three times greater than the Index median of 13.2x. Snowflake (SNOW) boasts a 94.0x EV/Revenue (ttm).
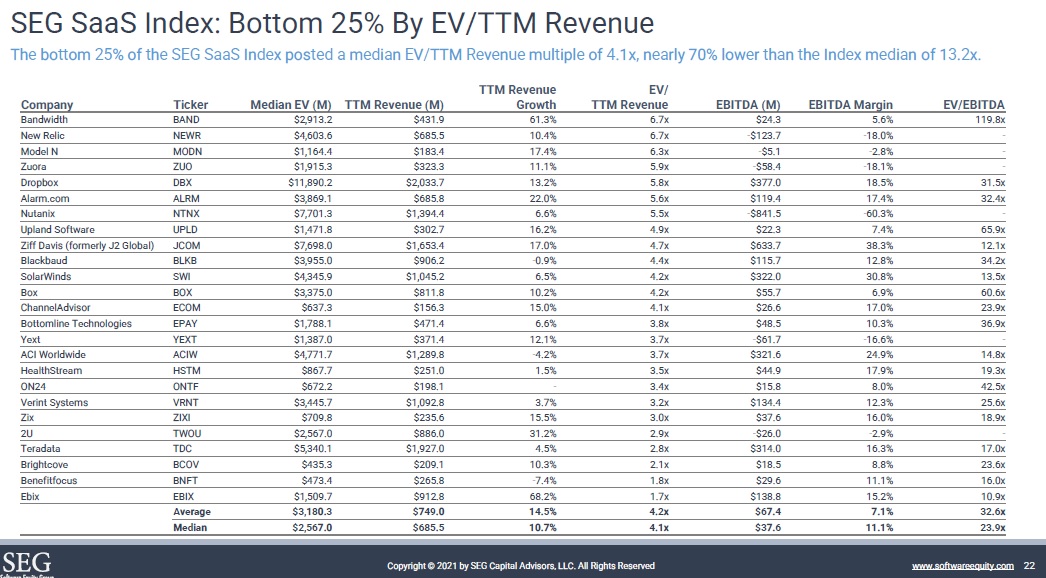
Bottom 25% SaaS Index
The bottom 25% of the SEG SaaS Index posted a median EV/TTM Revenue multiple of 4.1x, nearly 70% lower than the Index median of 13.2x.
Also published on Medium.