2021 Benchmarks for SaaS Firms Under $25 Million in Revenue
Understanding how your firm performs in relation to your competitors and industry is important. While there are a lot of metrics and benchmarks for SaaS companies, most are for large companies that are also publicly traded. Finding benchmarks about revenue, expenses, and valuation for private firms with less than $25 million in revenue is tough. This post presents 20 benchmarks and metrics for private SaaS firms under $25 million in revenue. The data is from four research reports that cover over 500 SaaS firms’’ performance in 2020 and 2021. You can compare your company’s performance using an included Excel file.
Baseline Research
This analysis is based on four research reports. You can download the actual reports below:
- Key Bank Capital Markets 2021 SaaS Metrics report
- Bessemer Ventures Scaling to $100 Million
- Software Equity 2021 Annual Report
- Software Equity October 2021 Update
Benchmark/Metrics Index
20 different benchmarks/metrics that cover revenues, expenses, and valuation are presented:
- Revenue Benchmarks
- 2020 Organic Revenue Growth for SaaS Firms Under $25 Million
- Average CAC Payback for SaaS Firms Under $25 Million
- Gross & Net Revenue Retention for SaaS Firms Under $25 Million
- YoY Revenue Growth Rate Trends for SaaS Firms Under $25 Million
- Median Revenue/Employee for SaaS Firms Under $25 Million
- Upsell & Expansion Sales as % of ARR For SaaS Firms Under $25 Million
- Median Revenue Growth & EV/Revenue Ratio Based on SaaS Category
- 2020 ARR Revenue Growth Based on SaaS Category
- Organic ARR Revenue Growth for SaaS Firms Under $25 Million
- Expense Benchmarks
- Average Operating Expense Margins for SaaS Firms Under $25 Million
- Gross Margins for SaaS Firms Under $25 Million
- Average Operating Expense Margins for SaaS Firms Under $25 Million
- Sales & Marketing Expense Per SaaS Category
- Average SaaS Benchmarks for Under $25 Million Firm
- Free Cash Flow Margins for SaaS Firms Under $25 Million
- Go To Market Type Distribution for SaaS Firms Under $25 Million
- 2020 Growth vs Burn Tradeoff for SaaS Firms Under $25 Million
- Valuation Benchmarks
- Overall SaaS Firm Enterprise Value Revenue Multiples 2021
- Cloud Valuation Multiples by SaaS Category Type
- Cloud Valuation Multiples for SaaS Firms Under $25 Million
- EV/Revenue Discounts for SaaS Firms Under $25 Million
- EV Discounts for Private SaaS firms vs Public SaaS Firms
Revenue Benchmarks
2020 Organic Revenue Growth for SaaS Firms Under $25 Million
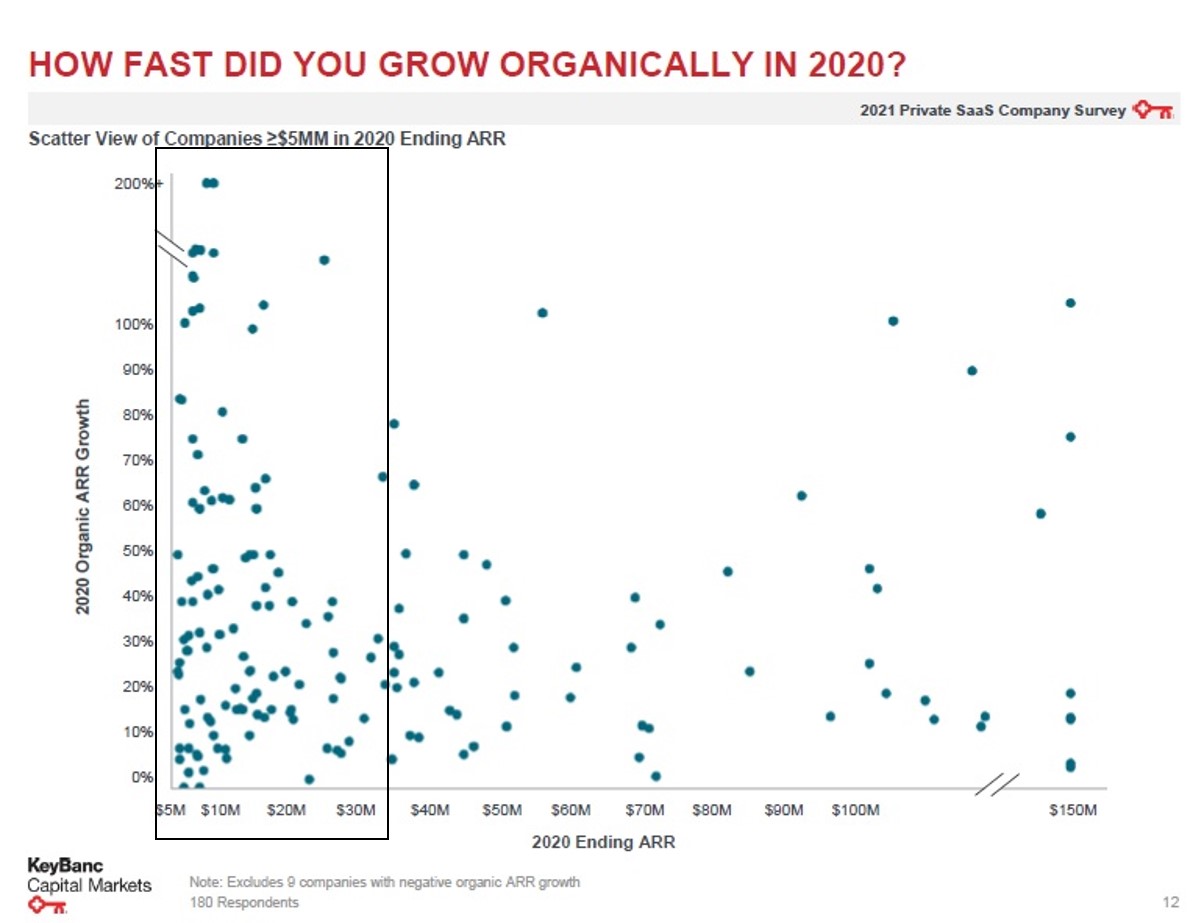
Key Bank Capital Markets 2021 SaaS Metrics report
Average CAC Payback for SaaS Firms Under $25 Million
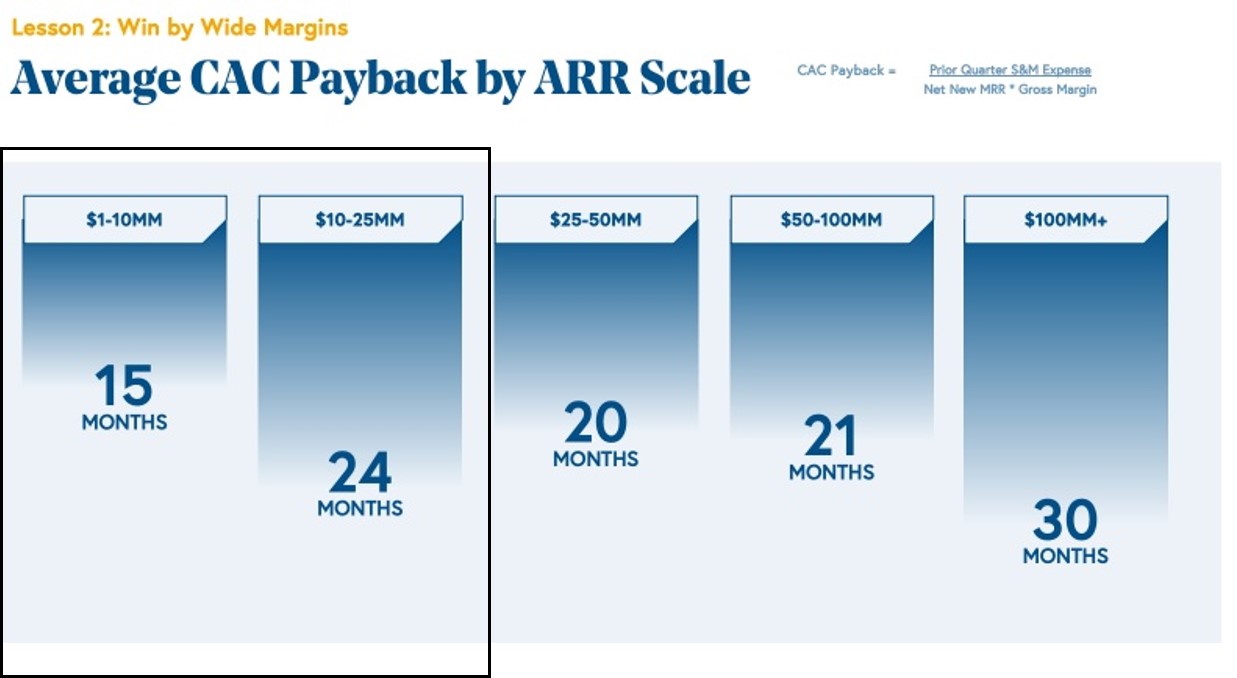
Bessemer Ventures Scaling to $100 Million
Gross & Net Revenue Retention for SaaS Firms Under $25 Million

Bessemer Ventures Scaling to $100 Million
YoY Revenue Growth Rate Trends for SaaS Firms Under $25 Million
Bessemer Ventures Scaling to $100 Million
Median Revenue/Employee for SaaS Firms Under $25 Million
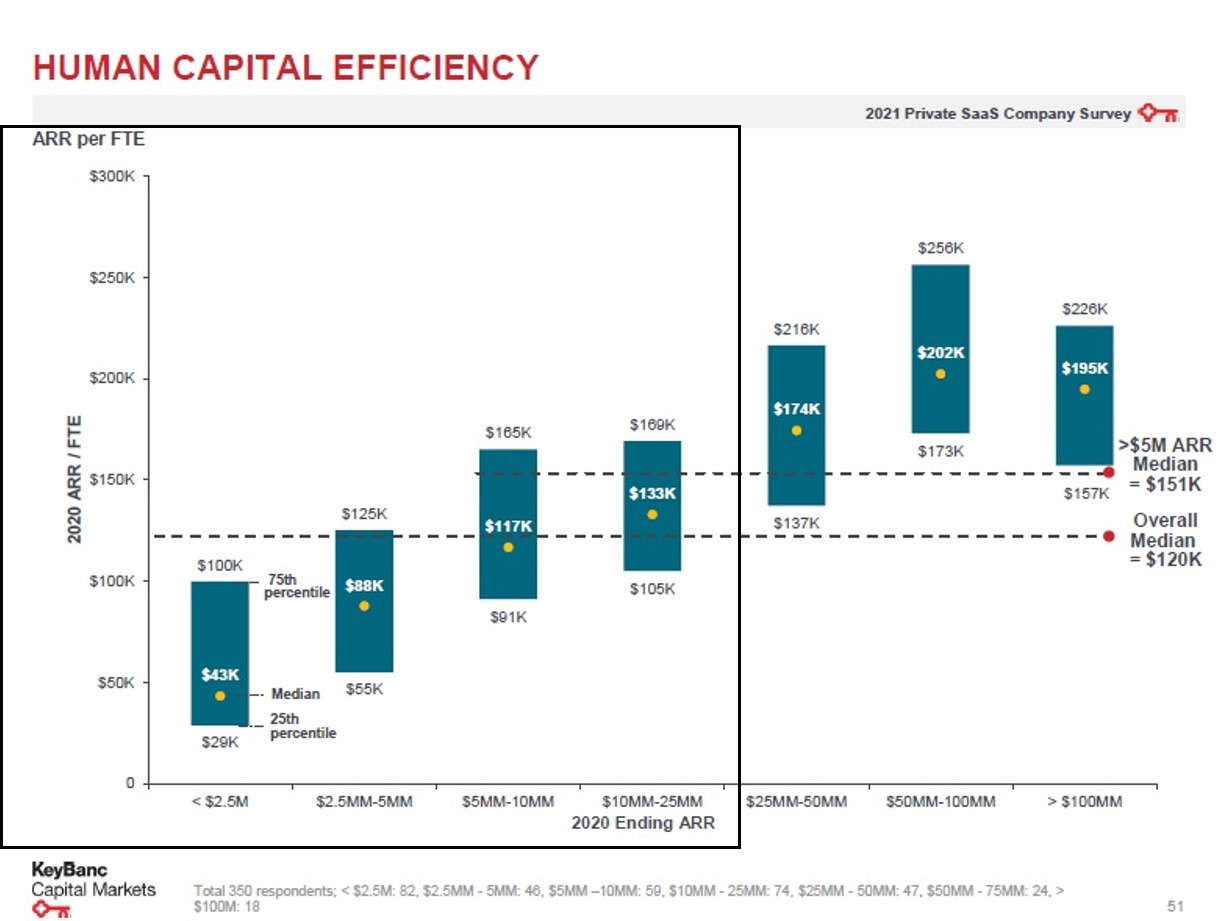
Key Bank Capital Markets 2021 SaaS Metrics report
Upsell & Expansion Sales as % of ARR For SaaS Firms Under $25 Million
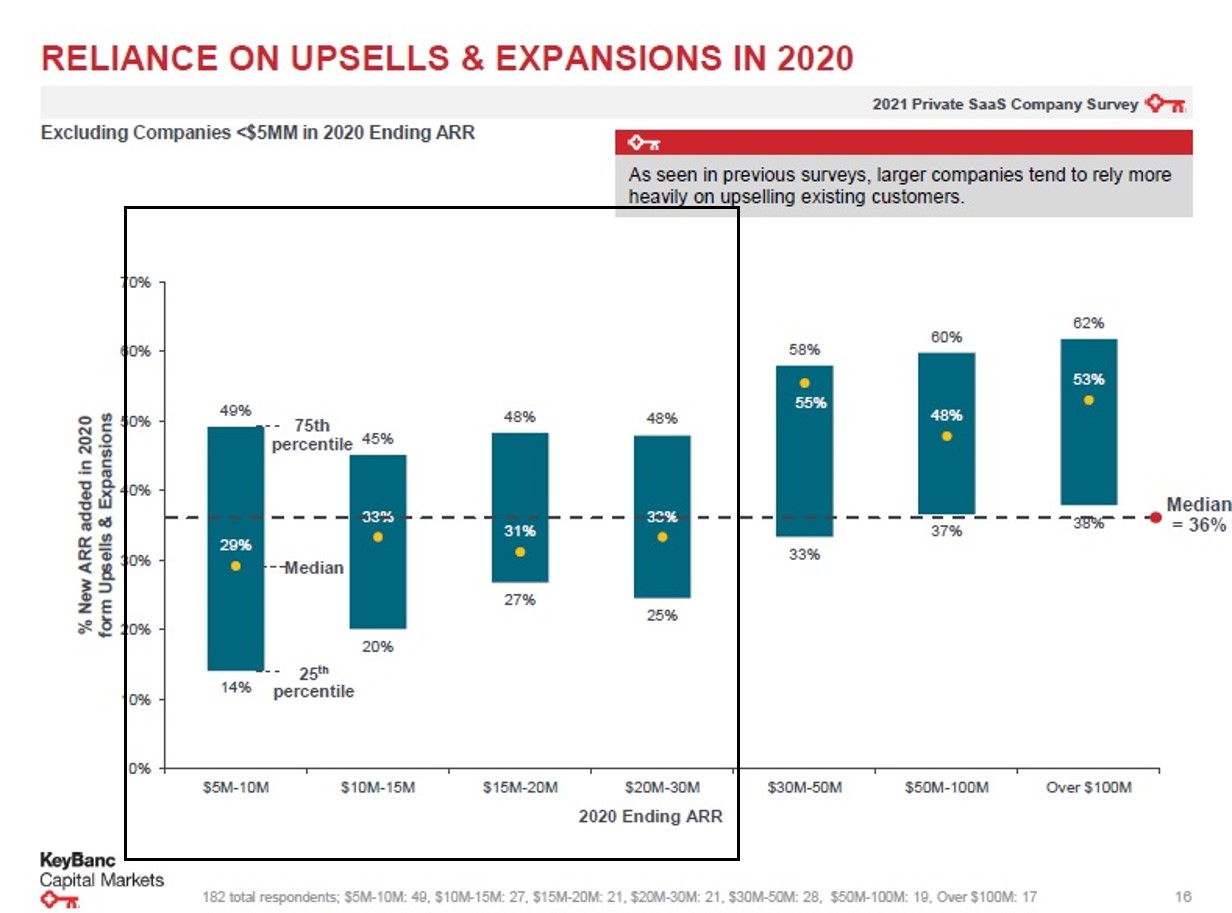
Key Bank Capital Markets 2021 SaaS Metrics report
Median Revenue Growth & EV/Revenue Ratio Based on SaaS Category
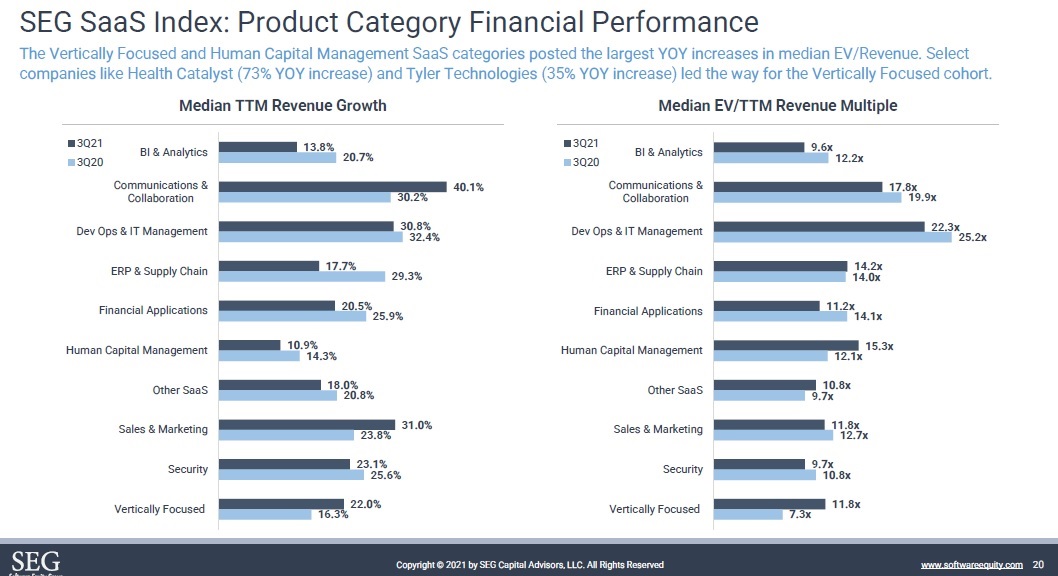
Note: This data covers public SaaS firms contained in the Software Equity Group SEG SaaS Index.
Software Equity October 2021 Update
2020 ARR Revenue Growth Based on SaaS Category
Note: This analysis covers all of the companies covered in the Key Bank Capital Markets 2021 SaaS Metrics report
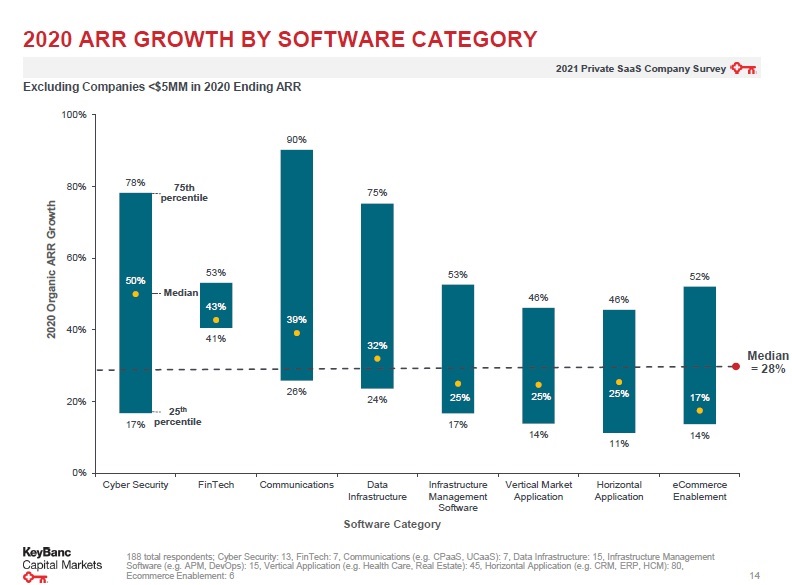
Key Bank Capital Markets 2021 SaaS Metrics report
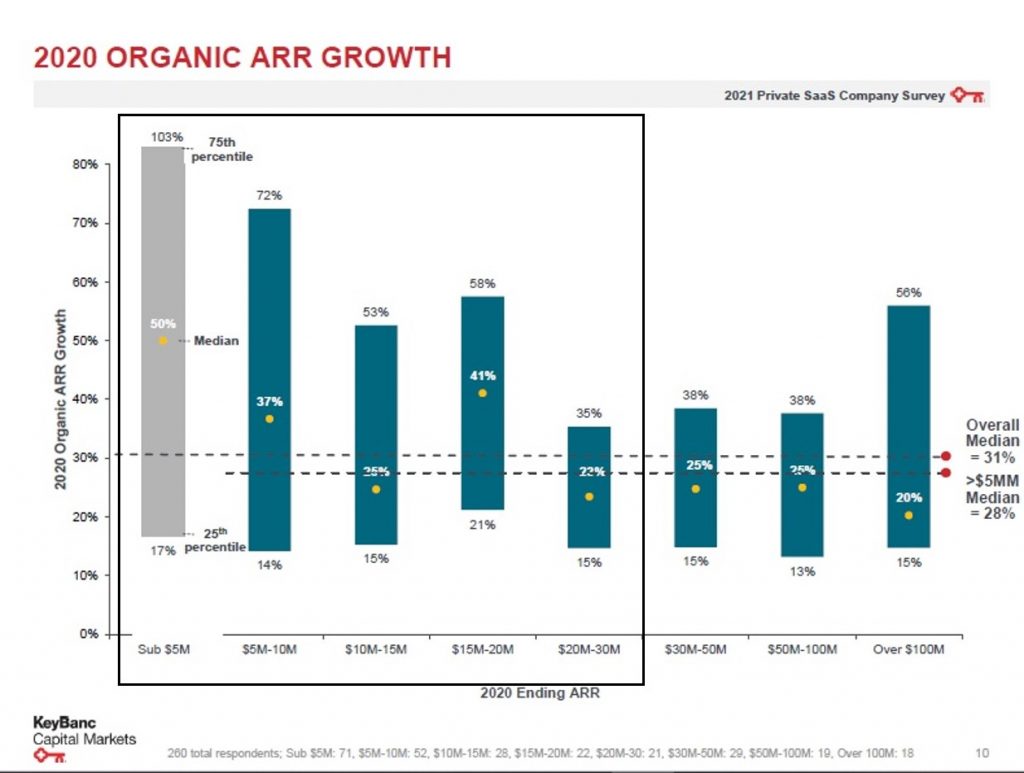
Organic ARR Revenue Growth for SaaS Firms Under $25 Million

Key Bank Capital Markets 2021 SaaS Metrics report
Expense Benchmarks
Average Operating Expense Margins for SaaS Firms Under $25 Million

Bessemer Ventures Scaling to $100 Million

Bessemer Ventures Scaling to $100 Million
Gross Margins for SaaS Firms Under $25 Million
Bessemer Ventures Scaling to $100 Million
Average Operating Expense Margins for SaaS Firms Under $25 Million
Key Bank Capital Markets 2021 SaaS Metrics report
Sales & Marketing Expense Per SaaS Category
Note: This analysis covers all of the companies covered in the Key Bank Capital Markets 2021 SaaS Metrics report

Key Bank Capital Markets 2021 SaaS Metrics report
Average SaaS Benchmarks for Under $25 Million Firm
Bessemer Ventures Scaling to $100 Million
Free Cash Flow Margins for SaaS Firms Under $25 Million
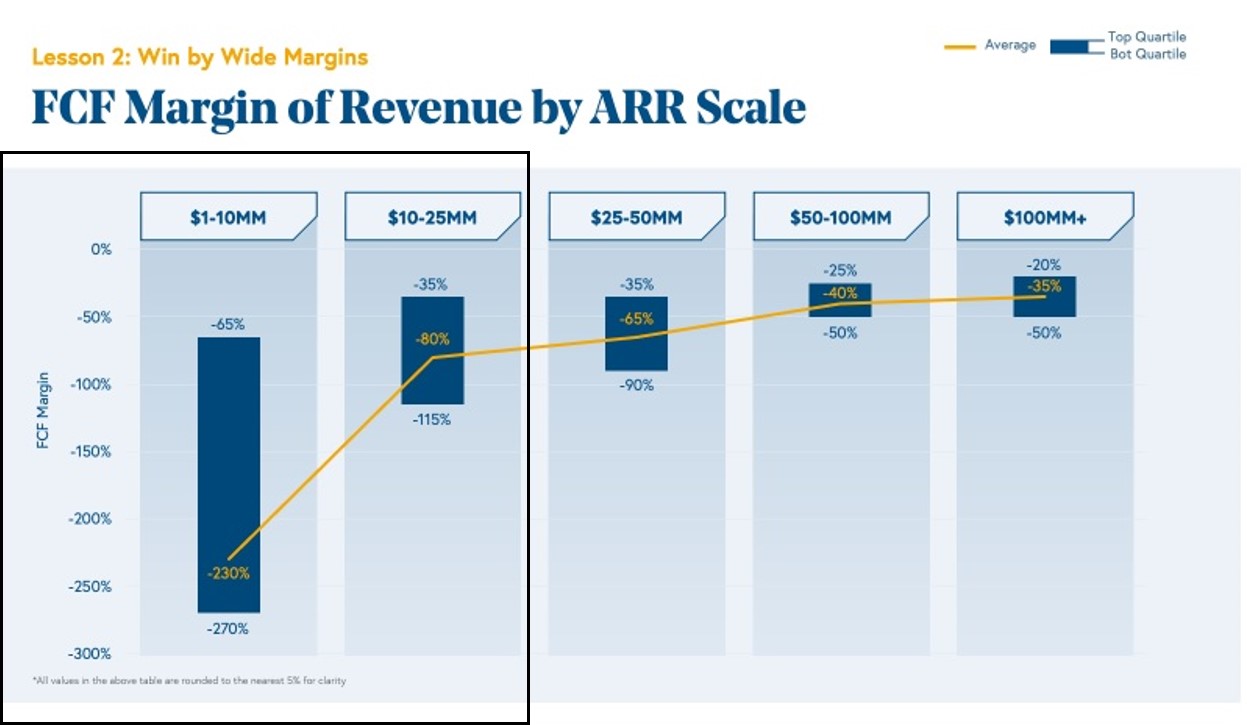
Bessemer Ventures Scaling to $100 Million
Go To Market Type Distribution for SaaS Firms Under $25 Million

Key Bank Capital Markets 2021 SaaS Metrics report
2020 Growth vs Burn Tradeoff for SaaS Firms Under $25 Million

Key Bank Capital Markets 2021 SaaS Metrics report
Valuation Benchmarks
Overall SaaS Firm Enterprise Value Revenue Multiples 2021
Note: This data covers public SaaS firms contained in the Software Equity Group SEG SaaS Index.
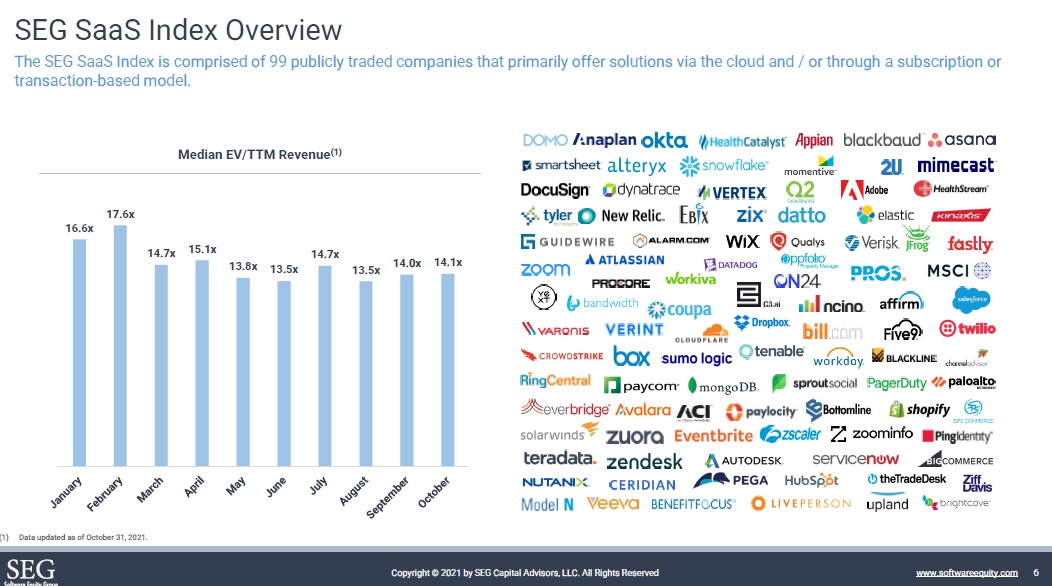
Software Equity October 2021 Update
Cloud Valuation Multiples by SaaS Category Type
Note: This data covers all of the portfolio companies included in the Bessemer Ventures Scaling to $100 Million

Bessemer Ventures Scaling to $100 Million
Cloud Valuation Multiples for SaaS Firms Under $25 Million
Bessemer Ventures Scaling to $100 Million
EV/Revenue Discounts for SaaS Firms Under $25 Million

Software Equity 2021 Annual Report
EV Discounts for Private SaaS firms vs Public SaaS Firms
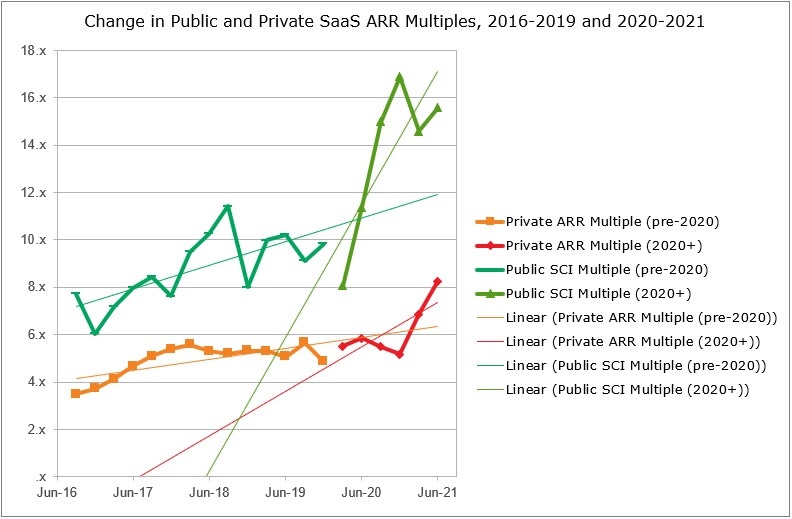
SaaS Capital Public-Private Valuation Gap Widens for SaaS Company Multiples
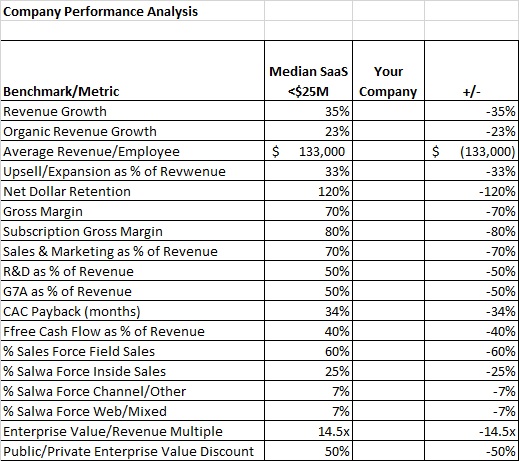
Assess Your Company’s Performance
You can assess your company’s performance against the benchmarks/metrics for SaaS firms under $25 million in revenue using the following spreadsheet. You can download a copy here.
Summary
Understanding how your firm performs in relation to your competitors and industry is important. While there are a lot of metrics and benchmarks for SaaS companies, most are for large companies that are also publicly traded. Finding benchmarks about revenue, expenses, and valuation for private firms with less than $25 million in revenue is tough. This post presents 20 benchmarks and metrics for private SaaS firms under $25 million in revenue. The data is from four research reports that cover over 500 SaaS firms’’ performance in 2020 and 2021. You can compare your company’s performance using an included Excel file.