2023 SaaS M&A in Review
I regularly track SaaS M&A. The Software Equity Group regularly publishes great research on SaaS M&A. Recently they released their SEG 2024 Annual SaaS Report. The report includes:
- An Overview of Public SaaS Companies. A thorough analysis of stock prices, financial data, and valuation performance for the 120+ publicly traded B2B software companies comprising their SEG SaaS Index™
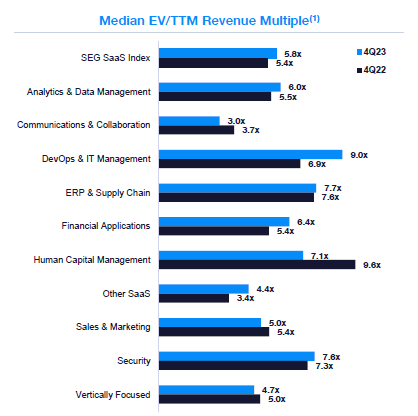
- SEG SaaS Index EV/Revenue by Product Category- Several categories in the Index reported higher median EV/TTM revenue multiples in 4Q23 compared to 4Q22, indicative of the robust performance witnessed by many companies in the Index. Notably, DevOps & IT Management (9.0x in 4Q23 vs. 6.9x in 4Q22) and Financial Applications (6.4x vs. 5.4x) experienced the two most significant increases in revenue multiples.
- Recapping SaaS M&A Activity. In 2023, there was a notable increase in M&A activity, showing a robust performance with a 9% rise over 2020, pre-COVID levels. Although the overall aggregate software M&A volume is now comparable to pre-2021 figures, the SaaS M&A segment continued its active momentum in 2023. With 2,062 transactions, it marked the second-highest total on record, closely following the peak in 2022. Despite a 4% decrease compared to 2022, 2023 exhibited a significant uptick compared to prior years, showing a 15% increase over 2021 and a substantial 58% surge compared to 2020.
2024 Global IT & Enterprise Software Spend Outlook
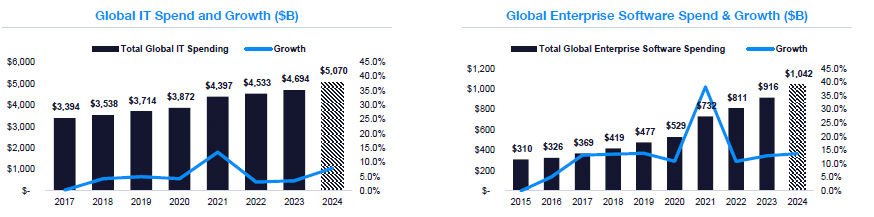
Global IT and Enterprise Software growth and spending are poised to continue strong growth. In 2021, both categories experienced unprecedented growth due to rapid digitization driven by COVID. However, 2022 marked a regression from peak growth and a return to more typical historical patterns. Nonetheless, the outlook remains robust.
Both categories are expected to cross impressive thresholds in 2024, with Global IT spend surpassing $5T and enterprise software spend surpassing $1T for the first time. Enterprise software, the fastest-growing IT segment, is expected to have grown 12.9% in 2023, with 2024 projected growth at 13.8%, outpacing the broader IT category’s growth of 3.5% and 8.0%, respectively. Software spend as a % of overall IT spend has nearly doubled since 2017 (10% to 20%), a remarkable feat considering the large dollar volume of IT spend (nearly $4.7T in 2023).
Overall Software Industry M&A: Deal Volume
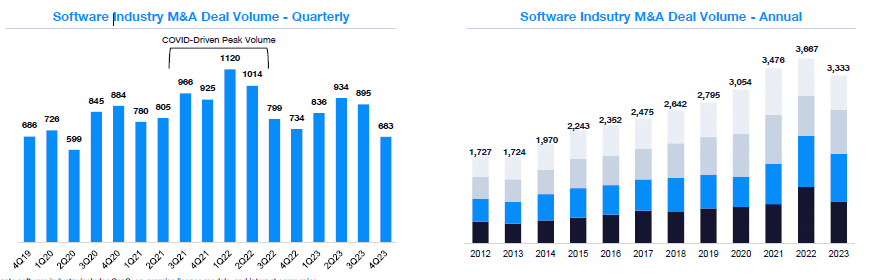
The aggregate software industry saw a decline in M&A volume in 2023, finishing the year with 3,333 deals compared to 3,667 in 2022, a decrease of ~9% YOY. 2021 and 2022 were unprecedented years for software M&A driven by COVID tailwinds. 3Q21 to 2Q22 averaged over 1000 deals per quarter, compared to an average of 829 deals per quarter in the four quarters prior. 2023 was a very strong year from a volume perspective compared to pre-COVID (up 9% over 2020) levels. Q423 did decline 7% YOY as it lacked some of the transaction catalysts that recent Q4s have seen (changes to tax code and potential legislation, to name a few). The macroeconomic uncertainty and high cost of capital also placed downward pressure on overall M&A volume.
EV/TTM Revenue Multiples
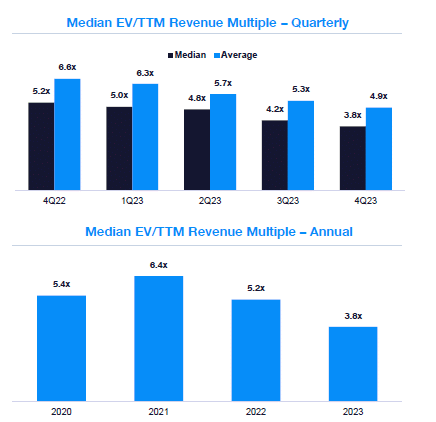
4Q23’s 3.8x median EV/TTM revenue multiple represents a 10% decrease in QOQ and a 27% decrease YOY. In 2023, a high volume of low-multiple deals impacted the median, creating a gap between the average and median, as high-quality assets continued to receive a premium relative to the market. 4Q23 saw the average M&A multiple receive a 29% premium to the median(4.9x compared to 3.8x), in line with historical quarters.The higher-than-usual volume of low multiple deals is a result of from negative transaction catalysts like evaporating cash runway, challenging debt dynamics, competitive concerns, or investors opting to exit their lower-performing assets to focus on high performers. While 2023 represents a local minimum compared to recent years for the SaaS M&A multiple, there is room for hope on the horizon. With the Federal Reserve widely expected to cut interest rates sometime before the election, the cost of capital will likely decrease, which could usher in a higher valuation environment. Our firsthand experience at SEG has taught us that a prime M&A target consists of profitable growth and strong retention. Businesses with these qualities are still seeing strong multiples.
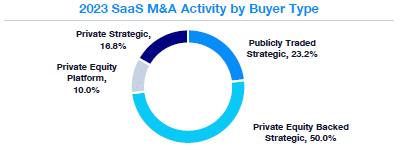
Rebound of Strategic Buyer
SEG SaaS Index Overview
Q4 SEG SaaS Index comprises 128 publicly traded companies that primarily offer solutions via the cloud(1). The Index is updated every quarter depending on acquisitions, IPOs, readily available financial data, and changes in business models. If a company is added or removed from the Index, we re-run historical data to include its financials and analyze how it changes the metrics.
SEG SaaS Index Annual Financial Performance
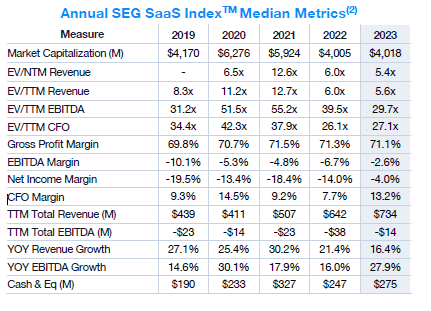
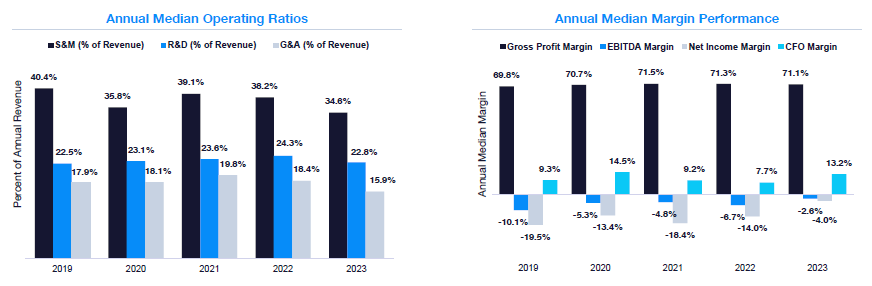
The Index’s rapid pivot to capital efficiencyis a big part of its success in 2023. The Index posted a median CFO margin of 13% in 2023, up from 8% in 2022. The 2023 median net income margin was -4% compared to -14% in 2022 and -18.4% in 2021, a stark contrast over just 2 years. The ability of SaaS companies, predominantly classified as growth stocks, to navigate a path toward profitability signifies a crucial moment for this asset class. To achieve this feat, companies in the Index have cut back on discretionary S&M and G&A spend, decreasing spend as a % of revenue in those categories to 35% and 16% in 2023, respectively. However, R&D spend held consistent with historical percentages, demonstrating the Index’s willingness to continue product investment for future growth, a good sign for performance in 2024 and beyond.
 SEG SaaS Index Product Category Valuation Performance
Many categories in the Index recorded higher median EV/TTM revenue multiples in 4Q23 than in 4Q22, reflecting the strong year many companies in the Index recorded.DevOps & IT Management (9.0x in 4Q23 vs. 6.9x in 4Q22) and Financial Applications (6.4x vs. 5.4x) saw the two largest increases in revenue multiple.DevOps & IT Management, with a 9.0x EV/TTM revenue mutiple, traded at a 61% premium to the Index median. The cohort contains highflyers like MongoDB (16.8x) and Datadog (16.7x), and the group broadly has seen massive tailwinds as artificial intelligence adds additional complexity for IT departments.ERP & Supply Chain, combining growth (16.8% TTM Revenue Growth) and profitability (21.1% TTM EBITDA Margin), exemplifies a cohort of public SaaS companies receiving recognition for achieving profitable growth. The group saw a TTM revenue multiple of 7.7x in 4Q23, 38% higher than the Index