
Product managers need to understand where their company fits in the competitive landscape from a fact-based perspective. All too often competitors are dismissed or over-aggrandized based on rumors or speculation. The Marketecture is a tool I have been using for over 25 years to model the competitive landscape of a given market quickly. The data points in the Marketecture can be rapidly gathered from various free sources. The information can inform product, marketing, and sales strategies from a fact-based perspective.
An Example Marketecture
I consult with many SaaS companies each month. While I am an expert in many markets (enterprise application development, supply chain management, systems management to name a few), There are hundreds I am a novice in. When I start a new engagement in a market I am not familiar with, the first thing I do is build a Marketecture.
Recently, I started working with a last-mile delivery management platform. While I am generally familiar with shipping from my supply chain days, last-mile delivery was something new to me.
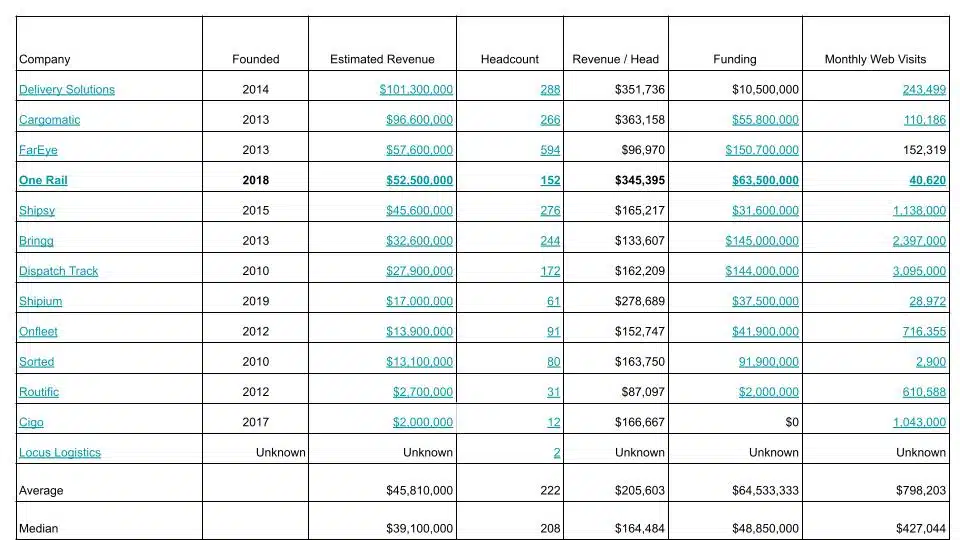
Here is the Marketecture I built. All of the links lead to the data sources where I found the information.
| Last Mile Delivery Platform Marketecture | |||||||
| Company | Founded | Estimated Revenue | Headcount | 12 Month Headcount Change | Revenue / Head | Funding | Monthly Web Visits |
| Delivery Solutions | 2014 | $101,300,000 | 288 | 45% | $351,736 | $10,500,000 | 243,499 |
| Cargomatic | 2013 | $96,600,000 | 266 | 17% | $363,158 | $55,800,000 | 110,186 |
| FarEye | 2013 | $57,600,000 | 594 | -8% | $96,970 | $150,700,000 | 152,319 |
| One Rail | 2018 | $52,500,000 | 152 | 10% | $345,395 | $63,500,000 | 40,620 |
| Shipsy | 2015 | $45,600,000 | 276 | -15% | $165,217 | $31,600,000 | 1,138,000 |
| Bringg | 2013 | $32,600,000 | 244 | $133,607 | $145,000,000 | 2,397,000 | |
| Dispatch Track | 2010 | $27,900,000 | 172 | 29% | $162,209 | $144,000,000 | 3,095,000 |
| Shipium | 2019 | $17,000,000 | 61 | 7% | $278,689 | $37,500,000 | 28,972 |
| Onfleet | 2012 | $13,900,000 | 91 | -13% | $152,747 | $41,900,000 | 716,355 |
| Sorted | 2010 | $13,100,000 | 80 | -22% | $163,750 | 91,900,000 | 2,900 |
| Routific | 2012 | $2,700,000 | 31 | 3% | $87,097 | $2,000,000 | 610,588 |
| Cigo | 2017 | $2,000,000 | 12 | 0% | $166,667 | $0 | 1,043,000 |
| Locus Logistics | Unknown | Unknown | 2 | 0% | Unknown | Unknown | Unknown |
| Average | $45,810,000 | 222 | $205,603 | $64,533,333 | $798,203 | ||
| Median | $39,100,000 | 208 | $164,484 | $48,850,000 | $427,044 |
The Marketecture Components
My standard Marketecture is composed of seven core data items. Sometimes I add more depending on a client’s specific requirements. The data items and sources include:
Competitor Name
The first column is the name of the competitor with a link to their home page.
I build a list of potential market players a number of ways. I start with a simple prompt to either chatGPT or Gemini – “Who are the major competitors of company X?”. I check to see if there are any Gartner Group Magic Quadrants. I also check G2.com to see if there is a G2 Grid. The goal is to generate a list of candidate competitors to study. The list may be shortened at the end of the investigation, but you have to start somewhere.
Year Founded
The next column is the year the competitor was founded. Generally, I use data from the firm´s LinkedIn profile, since I capture several other data points from the LinkedIn profile. Go to the competitor’s About tab:

Estimated Revenue
Understanding the size of a competitor’s revenues is critical to understanding where they sit in the market ecosystem. Some competitors might be public companies. In that case, the 10-Q and 10-K reports they file with the SEC will tell you exactly what their revenues are. If you need help accessing and deciphering 10-K reports check out Why Product Managers Need to be Able to Read 10-K Filings.
Most competitors are privately held, they do not publicly release their financial statements. There are several free resources you can use. Check out Product Managers: How Can You Estimate Your Competitor’s Product Line Revenues? For six different techniques.
The one I use most often is Growjo.com. It is a free resource that I have found to be reasonably accurate. Here is what Growjo says about FarEye:

Headcount
The next column is headcount. Once again, I use LinkedIn. For example, here is FarEye’s headcount profile:

12 Month Headcount Growth
Headcount growth is a key indicator of competitor health. To find the relative headcount growth I use the paid feature of LinkedIn Sales Navigator. Here is what they say about FarEye:

A 29% decline over the last two years is an indication that FarEye is struggling.
Revenue/Head
This is simply a calculation of Estimated Revenue divided by Total Headcount.
Firms that are in the same market tend to have similar Revenue/Headcount numbers. There are some explanations for wide variances. Firms that have many employees based in low cost geographies often have lower numbers. FarEye has 497 of its 573 employees based in India. Companies that have raised a lot of venture capital and are growing rapidly tend to have lower numbers. DispatchTrack, which has raised $144 million in venture capital and grew its headcount 29% in the past year revenue/headcount is 22% lower than the market average.
Funding
The amount and timing of competitor venture capital investments tell a lot about its prospects and health. The best source of VC investment is Crunchbase. Crunchbase is a paid service that offers a few free inquiries each month. But you can access a competitor’s Crnchbase profile for free via LinkedIn.
When you look at a competitor’s LinkedIn About tab, you may see a Crunchbase link. FarEye´s looks like this:

When you click on the Show More link, you see:

Monthly Web Visits
Web traffic is a key sign of sales health. Similarweb provides great free traffic and SEO analysis.
Here is FarEye’s profile:

Tying It All Together
The elements of the Marketecture enable product managers to understand the size, scope, and relative health of its competitors from a fact-based perspective. It can help you devise effective strategies. The vast majority of data is freely available.
Also published on Medium.