The Ultimate Guide to SaaS Benchmarks for Pre-Seed Funded Startups
As the CEO of a pre-seed funded startup, understanding and applying key benchmarks can help you navigate the challenging landscape of growing a SaaS company with less than $1M in revenue. These benchmarks provide insights into your company’s performance, guiding your strategic decisions and helping you optimize growth and efficiency. Let’s explore these benchmarks in a simplified, easy-to-understand manner.
The benchmark 2024 B2B SaaS Benchmark Report presents comprehensive SaaS benchmark data segregated in several ways – annual revenue size, ACV, Go-To-Market Sales Motion, and Pricing Model. You can access the Interactive Benchmarks tool here. You can download the entire report here.
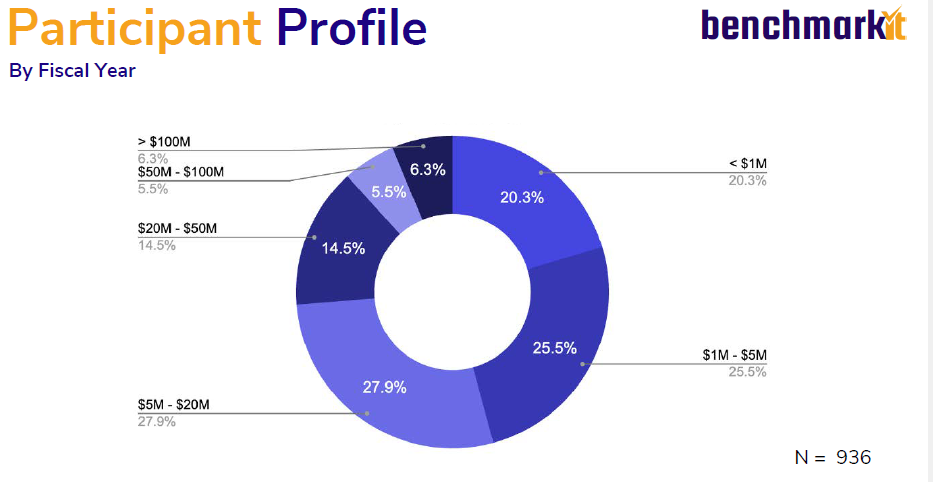
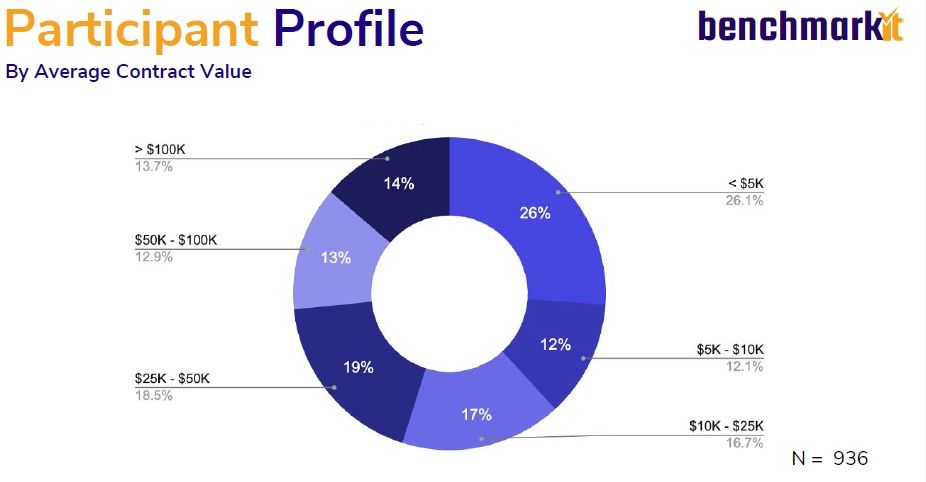
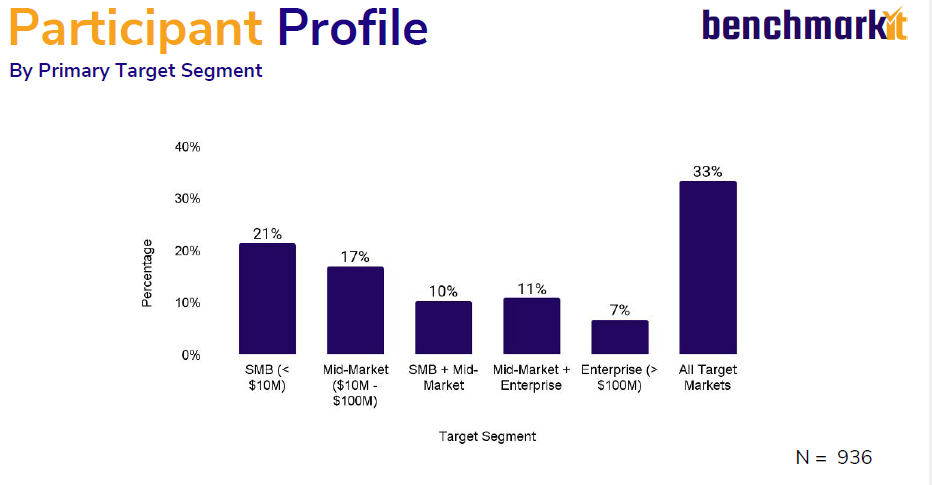
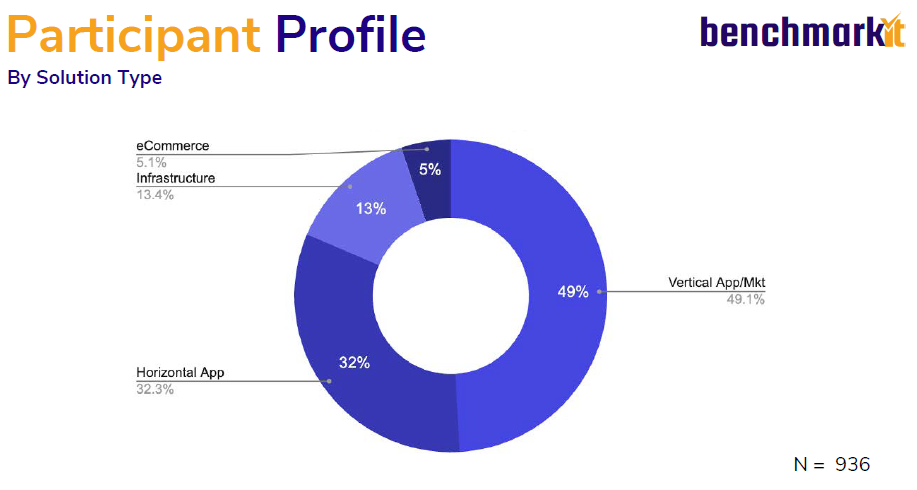
Study Demographics
The benchmarking study includes data from 936 SaaS firms, 187 of which had revenues of less than $1 million.
Benchmarks
This analysis covers fifteen benchmarks for SaaS firms that have less than $1 million in revenue. The benchmarks include:
- Company Growth Rate
- Expansion ARR to Growth ARR %
- Net Revenue Retention Rate
- Customer Logo Retention Rate
- New Customer CAC Ratio
- Expansion Customer CAC Ratio
- CLTV to CAC Ratio
- Gross Revenue Retention Rate
- R&D Expenses to Revenue %
- G&A Expenses to Revenue %
- S&M Expenses to Revenue %
- Gross Margin
- Gross Margins – Subscriptions
- EBITDA Percentage
- Free Cash Flow Percentage
Company Growth Rate
Definition: The Company Growth Rate measures how quickly your company is increasing its revenue over a specific period, usually annually.
Importance: For early-stage companies, high growth rates are crucial for attracting investors and gaining market traction. Consistently tracking and aiming to improve your growth rate ensures that your company is on the right path.
Example: If your company’s revenue was $500,000 last year and is projected to be $750,000 this year, your growth rate is 50%.

Expansion ARR to Growth ARR %
Definition: This metric measures the percentage of your company’s new Annual Recurring Revenue (ARR) that comes from existing customers expanding their subscriptions.
Importance: Higher expansion ARR indicates strong customer satisfaction and the effectiveness of upselling or cross-selling strategies.
Example: If your total new ARR is $100,000 and $40,000 comes from existing customers, your Expansion ARR to Growth ARR % is 40%.

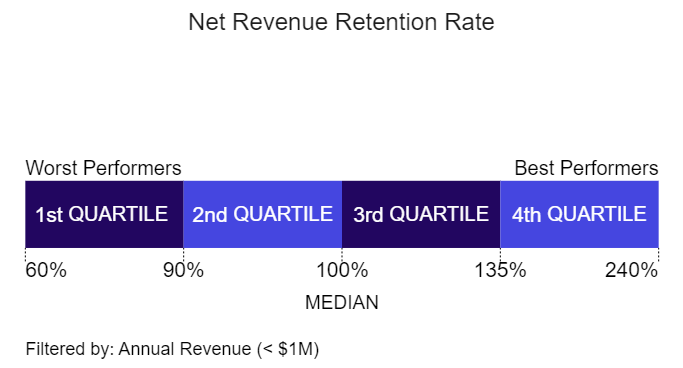
Net Revenue Retention Rate
Definition: The Net Revenue Retention Rate (NRR) measures the percentage of recurring revenue retained from existing customers, accounting for upgrades, downgrades, and churn.
Importance: NRR shows how well your company retains and grows its customer base over time. An NRR over 100% means your existing customers are spending more each year.
Example: If you start the year with $100,000 in ARR, lose $10,000 from churn, and gain $20,000 from upsells, your NRR is 110%.
Customer Logo Retention Rate
Definition: Customer Logo Retention Rate indicates the percentage of customers you retain over a period, not just the revenue.
Importance: High retention rates suggest customer satisfaction and loyalty, which are crucial for sustainable growth.
Example: If you had 100 customers at the start of the year and retained 90 of them, your Customer Logo Retention Rate is 90%.

New Customer CAC Ratio
Definition: The New Customer Customer Acquisition Cost (CAC) Ratio measures how much you spend on sales and marketing to acquire one dollar of new ARR.
Importance: This ratio helps you understand the efficiency of your customer acquisition efforts. A lower ratio indicates better efficiency.
Example: If you spent $200,000 on sales and marketing and acquired $100,000 in new ARR, your New Customer CAC Ratio is 2.

Expansion Customer CAC Ratio
Definition: The Expansion Customer CAC Ratio measures the cost of acquiring additional ARR from existing customers.
Importance: It is generally cheaper to expand existing customer accounts than to acquire new ones. Tracking this ratio helps optimize your spending.
Example: If you spent $50,000 on sales and marketing to generate $100,000 in expansion ARR, your Expansion Customer CAC Ratio is 0.5.

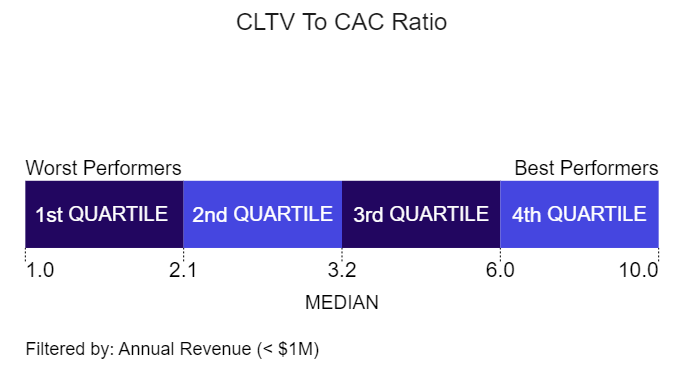
CLTV to CAC Ratio
Definition: The Customer Lifetime Value (CLTV) to CAC Ratio compares the value of a customer over their lifetime to the cost of acquiring that customer.
Importance: A higher ratio indicates that the value of your customers significantly exceeds the cost of acquiring them, suggesting a sustainable business model.
Example: If your CLTV is $1,000 and your CAC is $200, your CLTV to CAC Ratio is 5.
Gross Revenue Retention Rate
Definition: Gross Revenue Retention Rate measures the percentage of recurring revenue retained from customers, excluding any upsell or cross-sell.
Importance: This metric helps you understand the baseline retention of your customer base without the influence of expansion.
Example: If you start the year with $100,000 in ARR and lose $10,000, your Gross Revenue Retention Rate is 90%.

R&D Expenses to Revenue %
Definition: This metric shows the percentage of your revenue spent on Research and Development (R&D).
Importance: Investing in R&D is crucial for innovation and staying competitive in the SaaS market. Balancing this investment is key to maintaining growth and operational efficiency.
Example: If your revenue is $500,000 and you spend $100,000 on R&D, your R&D Expenses to Revenue % is 20%.

G&A Expenses to Revenue %
Definition: General and Administrative (G&A) Expenses to Revenue % measures the portion of revenue spent on general administrative functions like HR, finance, and management.
Importance: Keeping G&A expenses in check ensures more revenue is available for growth-driving activities.
Example: If your revenue is $500,000 and your G&A expenses are $50,000, your G&A Expenses to Revenue % is 10%.

S&M Expenses to Revenue %
Definition: Sales and Marketing (S&M) Expenses to Revenue % indicates the proportion of revenue spent on acquiring and retaining customers.
Importance: This metric helps you assess the efficiency of your sales and marketing efforts and make adjustments as needed.
Example: If your revenue is $500,000 and your S&M expenses are $150,000, your S&M Expenses to Revenue % is 30%.

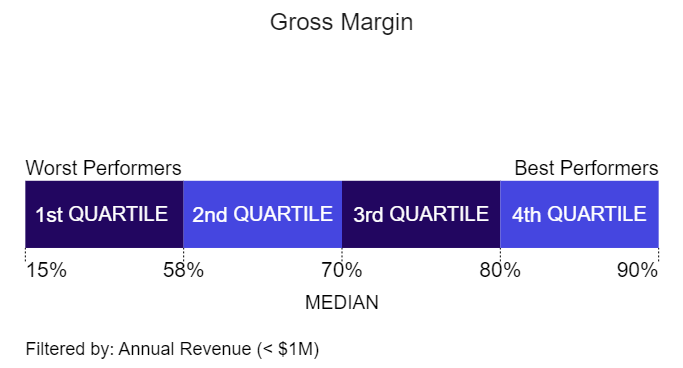
Gross Margin
Definition: Gross Margin is the percentage of revenue remaining after subtracting the cost of goods sold (COGS).
Importance: A high gross margin indicates that your company retains more money from each dollar of revenue, which can be used for other expenses like marketing and R&D.
Example: If your company has $500,000 in revenue and $150,000 in COGS, your gross margin is 70%.
Gross Margins – Subscriptions
Definition: This is the gross margin specifically for subscription revenue, excluding other types of revenue like services or one-time sales.
Importance: High subscription gross margins indicate efficient delivery of your core SaaS product.
Example: If your subscription revenue is $400,000 and the COGS for subscriptions is $80,000, your subscription gross margin is 80%.

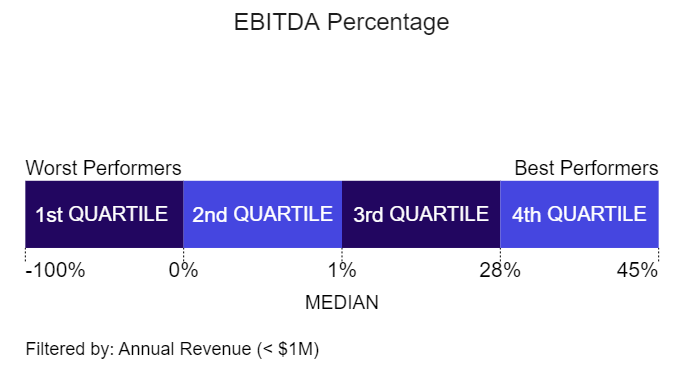
EBITDA Percentage
Definition: EBITDA (Earnings Before Interest, Taxes, Depreciation, and Amortization) Percentage measures your operating profitability as a percentage of total revenue.
Importance: This metric provides insight into your company’s operational efficiency and profitability before accounting for non-operational expenses.
Example: If your revenue is $500,000 and your EBITDA is $100,000, your EBITDA Percentage is 20%.
Free Cash Flow Percentage
Definition: Free Cash Flow Percentage measures the percentage of revenue remaining after covering all operating expenses, capital expenditures, and other cash outflows.
Importance: Positive free cash flow indicates that your company generates enough cash to fund its operations and growth without relying on external financing.
Example: If your revenue is $500,000 and your free cash flow is $50,000, your Free Cash Flow Percentage is 10%.


