Why Do Product Manager Value Equations Suck?
Value equations describe the quantitative and qualitative benefits a customer can receive from implementing a software product. They answer the buyer’s inevitable question “What’s in it for me?” Recently I worked with a SaaS company that had what I considered to be a cool product. They were struggling competing in the marketplace against some very well-funded competitors. While they were great at explaining all of their cool features, they struggled to crisply and credibly explain what value customers would get. They relied on generic statements like reducing customer churn and increasing productivity. When asked to back up their statements with hard numbers and credible customer success stories they drew a blank. Most product managers are in the same boat. They cannot cite credible fact-based evidence to back up their generic value statements. This is one of the reasons why product manager value equations suck.
Marketing Statistics Are Hard . . . Sometimes It’s Just Easier to Make Them Up
A friend of mine wrote a great article in 2009 “Marketing Statistics Are Hard . . . Sometimes It’s Just Easier to Make Them Up” A salient quote from the article:
“The challenge is that most marketing teams have never built valid case studies that could give rise to real proof points. The teams often lack the financial literacy to actually calculate the proof points and they rarely can get access to or permission from real customers to do this type of analysis. When push comes to shove from the sales team, marketing organizations often just make up proof points and hope that no one ever challenges their validity. “
Marketing Statistics Are Hard . . . Sometimes It’s Just Easier to Make Them Up”
The author of the post, Jon Gatrell, tells the story of EHarmony.com, Match.com, and PlentyofFish.com
The Wall Street Journal’s ‘Numbers Guy’, Carl Bialik, just published an article entitled ‘Marriage-Maker Claims Are Tied in Knots. The subtitle of the article is ‘Online Dating Sites Say Hordes of People Ultimately Marry, but Their Methods Have Plenty of Hitches of Their Own.’ In the piece Carl talks about the bogus nature of online dating sites claims of the number of marriages that have occurred as a result of people hooking up on the site.
“Online-dating sites have changed romance for millions of Americans. But claims that such dating leads to hordes of newly wedded couples may be fairy tales.
EHarmony claims in television or online ads in the U.K., U.S. and Australia that 2% of Americans who got married last year met through its site. But the stat is based on an online survey. Similarly, a Match.com media kit claimed that 12 marriages a day trace their roots to the site, but the company now says it’s inaccurate. And Markus Frind, chief executive and founder of Plenty of Fish, doesn’t advertise about marriages but says his site brings about 100,000 marriages a year, a figure based in part on “some study I found online.
Regretfully, many product managers resort to the same type of tactics.
Turn a Nugget of Gold into a Goldmine
Another popular tactic is to take one fact and spin it into the justification for an entire industry
The 70% Myth
Consider the following quote from Pardot’s website in 2021 (Pardot is Salesforce’s marketing automation solution):
“We’ve all heard this popularly-quoted statistic: that 70% of the buyer’s journey is complete before a buyer even reaches out to sales (SiriusDecisions). Marketers and sales reps alike are having to adjust their strategies to cope with these changing consumer practices. But what can they do about the 70% of the buyer’s journey that they’re missing out on? What are buyers doing during this time?”
Pardot
Sirius Decisions later debunked the myth at one of their conferences in 2015. The data for the 2013 pronouncement came from a joint study by CEB Marketing Leadership Council and Google in 2011 and was updated in 2013. Here’s a link to the 2013 report.
It is amazing that a simple statistic can become technology marketing and sales gospel. We teach even our kids the importance of not believing everything you read on the Internet and to look at the actual source of a piece of information and make your own judgment of its credibility.
One Chart That Made an Industry
In the 1980s and 1990s, I was a proponent of Information Engineering. Information Engineering was centered on the concept of model-driven development. Structured models like Entity-Relationship Models, Data Flow Diagrams, and State Charts were the best tools to describe business requirements and system designs. Complete models could then be used to generate application code.
The core premise behind model-driven development was that structured diagrams were better tools to describe complex requirements than regular text. Noted experts like Barry Boehm and Glenford Myers published credible research that the earlier in the systems development life cycle a defect could be detected, the lower the cost would be to fix the defect. In 1987 Robert Grady published Software Metrics: Establishing a Company-Wide Program. He included this chart which justified the Structured Analysis and Information Engineering revolutions:
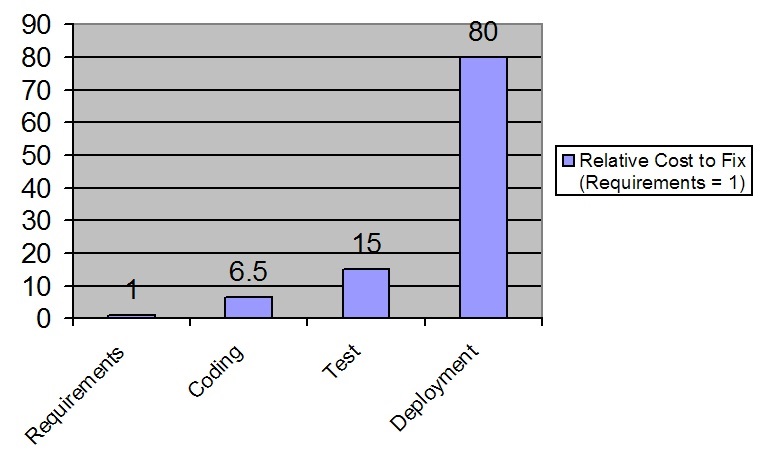
Simply put, the cost to fix a defect in the coding stage of the SDLC was 6.5x the cost of fixing i in the requirements phase. In the testing phase, it was 15x. After the application had been deployed to production it was 80x the cost of fixing it in the requirements phase.
Model-driven development postulated that structured models like Entity-Relationship Models enabled you to prevent syntactic and semantic errors that naturally occur in text-based specifications that spanned hundreds of pages.
Vendors like Index Technology, KnowledgeWare, Texas Instruments Software, Andersen Consulting, and Bachman Infomation Systems sold billions of dollars of Computer AIded Software Engineering workbenches.
For seasoned software professionals, Robert Grady’s analysis made intuitive sense. Few, if any, prospective customers actually dug into the actual research and its validity.
What Are Product Manager Value Equations
A value equation is the customer perceived benefits minus the cost of the solution. A proof point is an example that offers irrefutable evidence of the quality, importance, or uniqueness of something. Proof points need to be accurate, convincing, and believable.
Value equations should be structured like this:
<Action Verb> + <Value Statement> + <Quantifiable/Qualifiable Benefit>
Examples for a salesforce automation provider would be:
- Increase forecast accuracy by 48%
- increase lead rate conversion by 43%
- Increase win rate by 37%
In an excellent post, Create an Awesome Value Proposition with These 3 Points, Chris Goward, used the following chart to talk about value propositions:
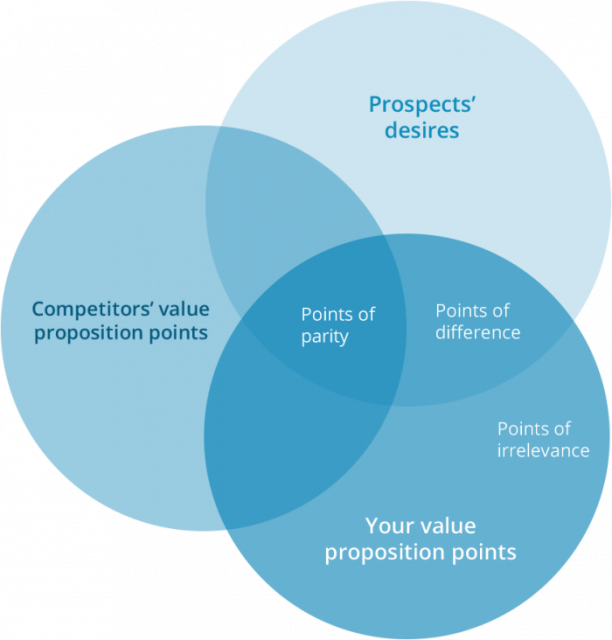
Chris goes on to say:
- Points of Parity (POPs): These are the features you offer that are important to your prospects that you also share with your competitors. Most marketers spend their time here, loudly trumpeting how they can do what their competitors do too, only *better*! That’s a strategy to fail.
- Points of Difference (PODs): Here’s where you can win the game. These are the features that are important to your prospects and not available from your competitors.
- Points of Irrelevance (POIs): You may have spent a lot of effort developing great features, but if nobody wants them, you should kill them.
Your PODs are where you should focus. These are the features you can emphasize that will move your prospects to action. They are your differentiators.
Product Manager Proof Points Must Be Credible
Once you have defined your value equations, you need to establish proof points. A proof point is an example that offers irrefutable evidence of the quality, importance, or uniqueness of something. If you can’t prove what you are asserting, you are no better than Markus Frind, CEO of Plenty of Fish,
In the pre-Internet days, credible prof points came from authors published by well-known firms like Prentice-Hall, Donnelly & Sons, Wiley, etc. Studies published by industry analysts like Gartner, Forester, or IDC were considered to be the ‘gold standard’. Peer-reviewed academic papers from places like Harvard University, Carnegie Mellom, and Stanford were very popular.
In 2021 things have changed. TrustRadius published a study B2B Buying Disconnect
Forecasting Radical Changes in Tech Buying Behavior that paints a different picture:
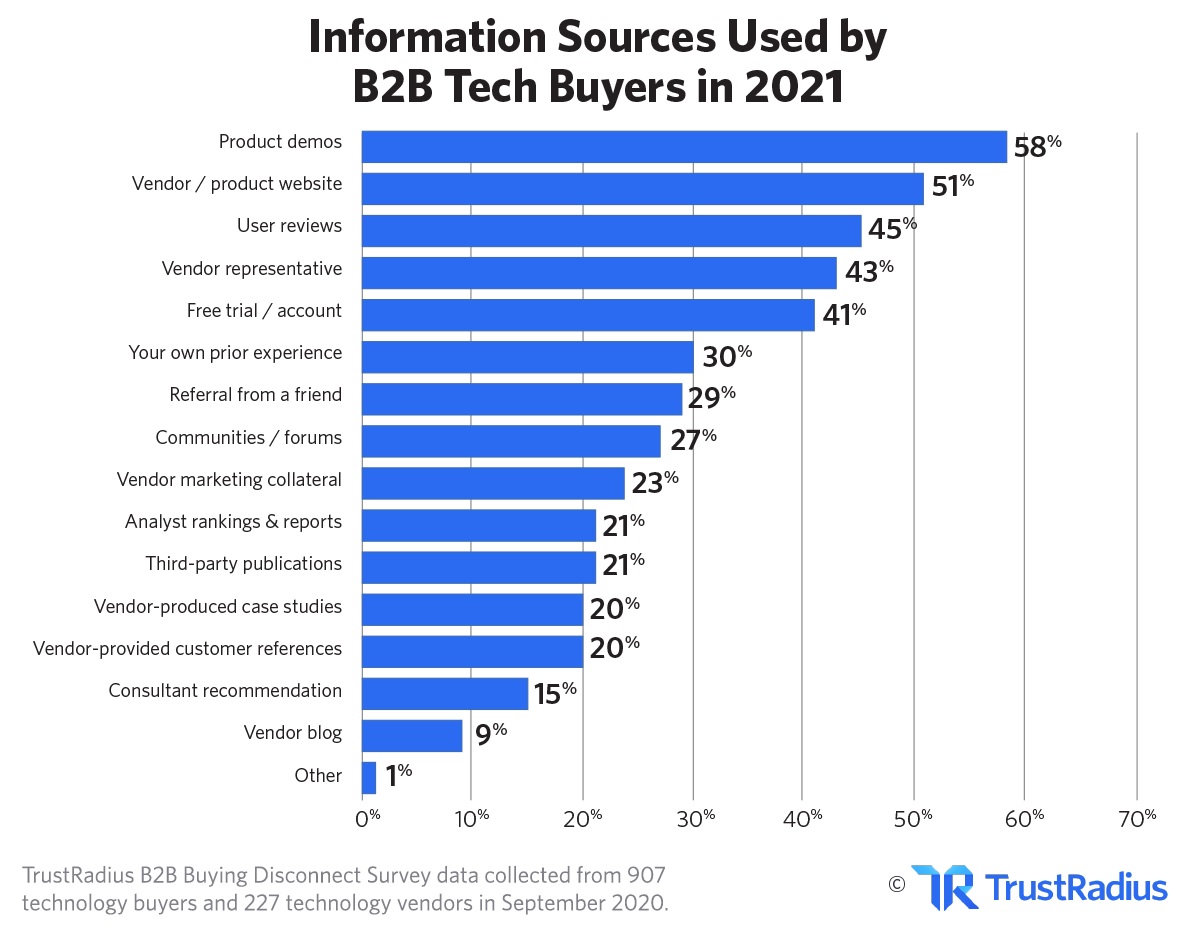
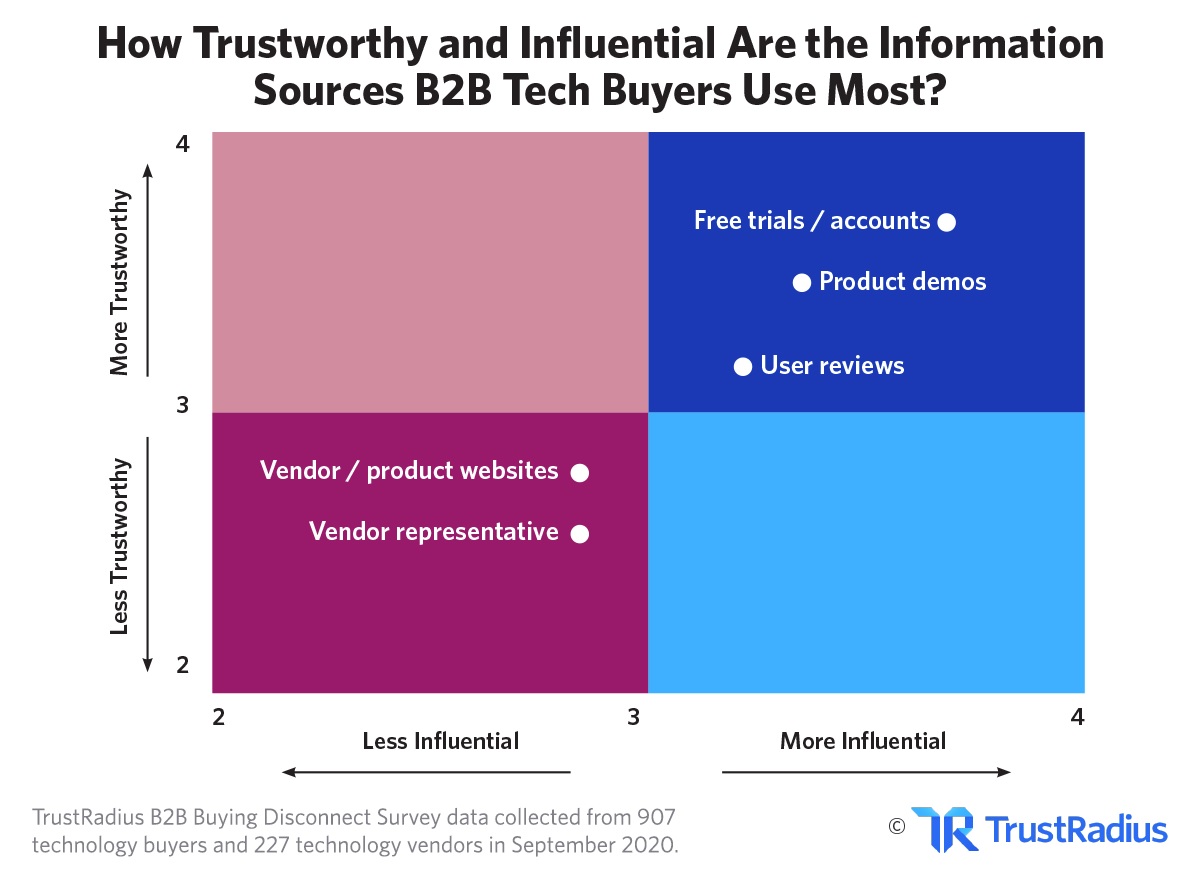
It is important to take the TrustRadius results with a grain of salt. TrustRadius is a user review site like Capterra, G2, and Software Advice. TrustRadius’ analysis is not statistically significant. As they point out:
Data for the TrustRadius 2021 B2B Buying Disconnect was sourced from the TrustRadius global network of contacts via an online survey in September 2020. We received responses from 907 technology buyers and 227 technology vendors, for a total of 1,134 survey respondents. All respondents were offered a nominal incentive ($15 gift card) as a thank-you for their time.
The majority of respondents work for organizations based in the United States. Other demographic information about company size, age, job title, and department can be found at the end of the full report here
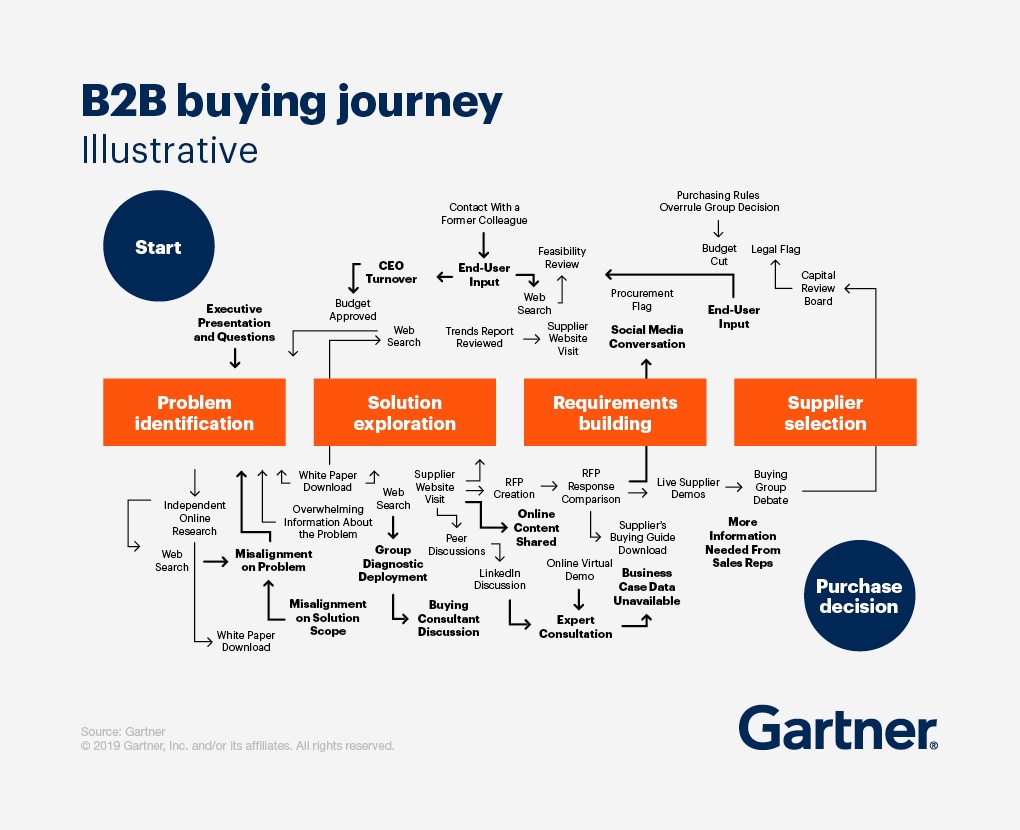
Undoubtedly the rise of user review sites reflects a change in the B2B SaaS buying process. Gartner Group points out the complexity of today’s B2B Buyers Journey:
How to Make Product Manager Value Equations Suck Less
There are four tactics you can use to improve your value equations and proof points:
1. Update Your Product Messaging Platform
A messaging platform organizes all of the key messages for your product. Consider the following diagram:
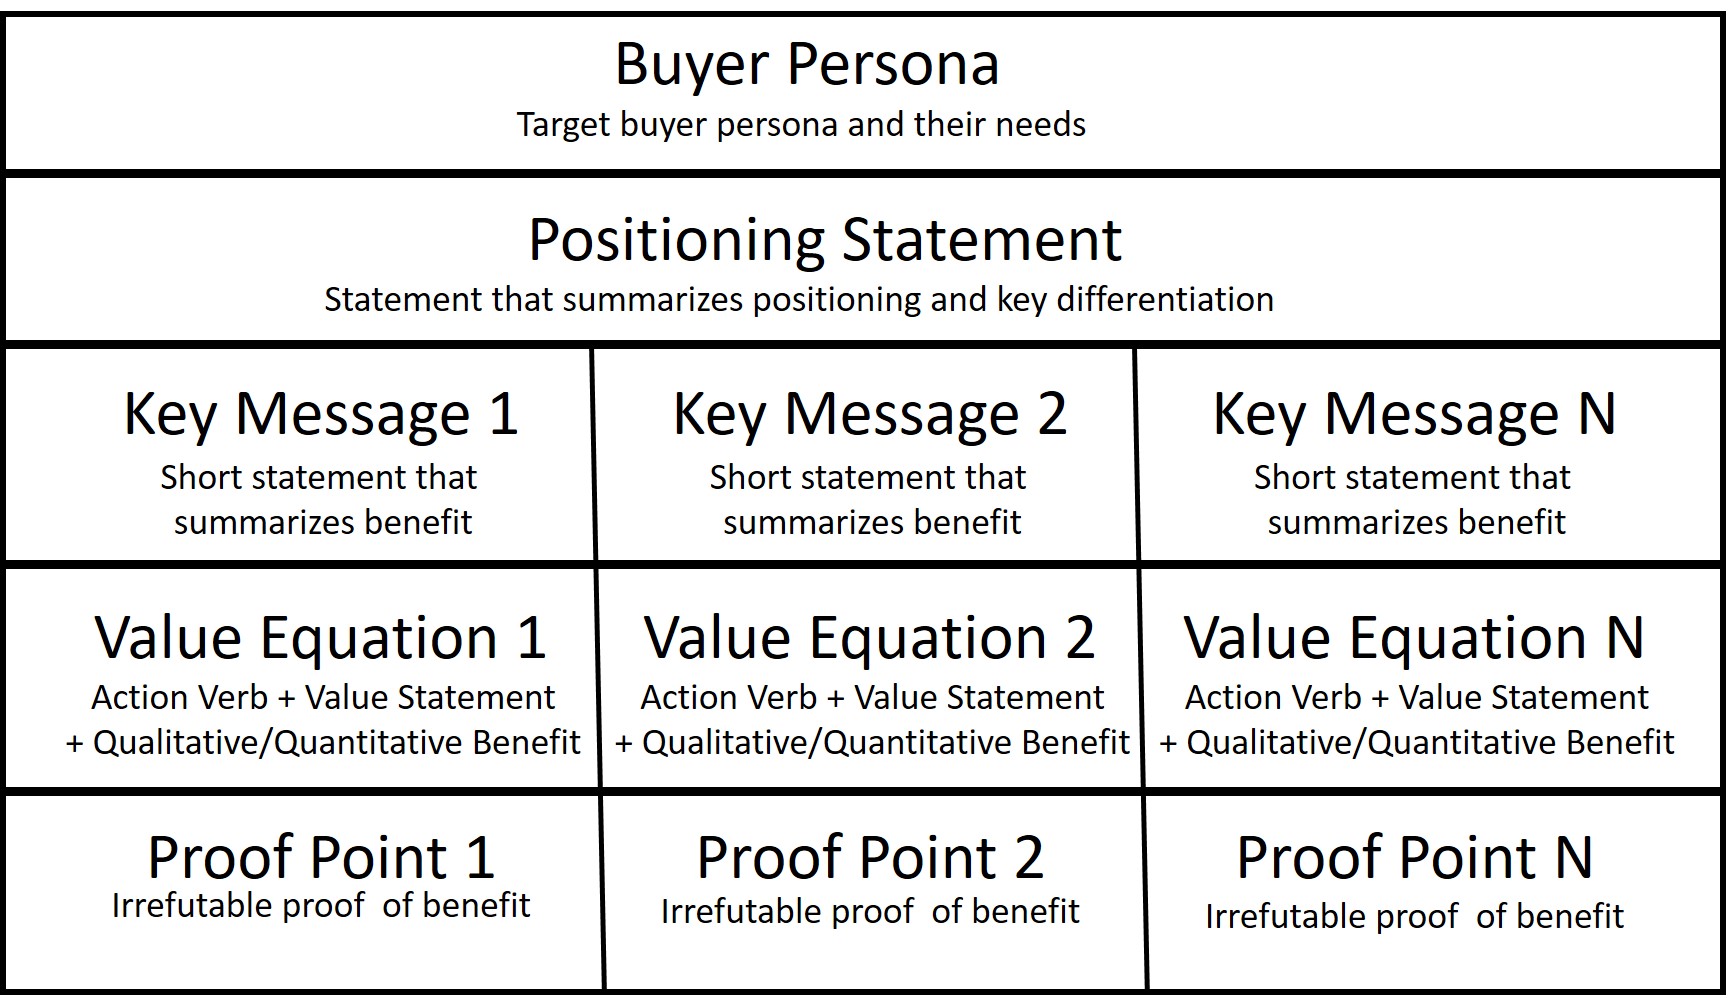
You should prepare a document like this for each of your buyer personas. If it takes you more than 15 minutes to build this for one persona, then you might have a problem.
2. Build an ROI/Benefit Calculator
If you don’t have irrefutable proof points yet, add an ROI/Benefit calculator to your website. These types of calculators are extremely helpful sales tools. Here are some example calculators for SaaS marketing automation providers:
- SalesForce: https://www.salesforce.com/form/app-cloud/roi-calc.jsp
- Hubspot: https://www.hubspot.com/roi-calculato r
- Act-On: https://www.act-on.com/learn/free-tools/economic-impact-calculator/
- Pardot: http://www.pardot.com/roi-calculator
- InfusionSoft: http://www.pardot.com/roi-calculator
- SharpSpring: https://sharpspring.com/alternatives /
Capture and retain the information prospects enter into the calculator. It will give you insights into how you can sharpen your value equations and proof points.
3. Refresh Your Analyst Relationships
While TrustRadius goes out of its way to denigrate industry analysts like Gartner and Forrester. Large-scale enterprises still value analyst firm opinions. Consider this Gartner Magic Quadrant for CRM lead generation solutions:
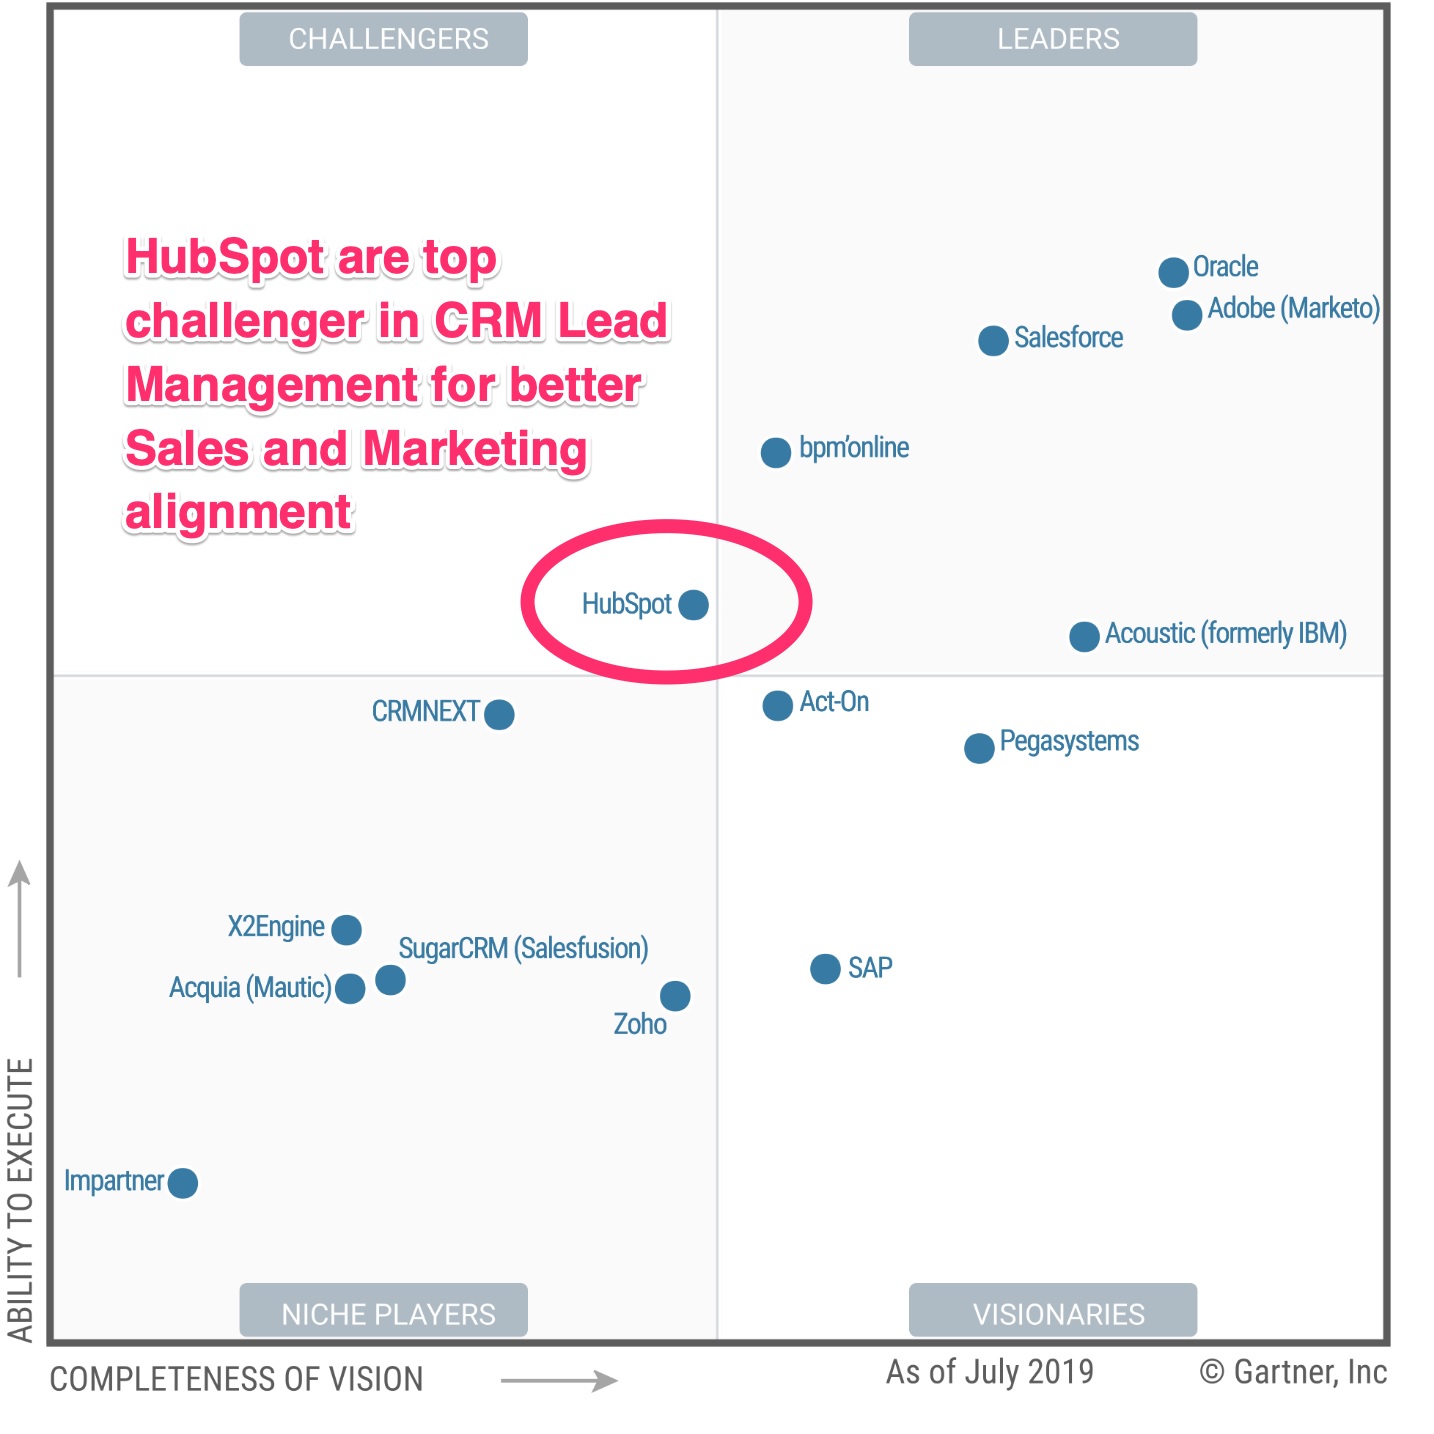
Getting categorized as anything but a leader can be problematic. Many enterprises will not include a vendor in an RFP if they are not included in a Gartner MQ.
Many people complain that there is a ‘Pay-to-Play’ issue with industry analysts like Gartner. I have worked with Gartner, Forrester, IDC, Ovum among others for over 25 years. While I have spent a fair amount of money on their services, I never received any preferential treatment.
It is possible to improve your relationship with analysts. You need to understand who is responsible for covering your market and what their priorities are. You need to feed them fact-based insights and proof points about your solution. I did that for one company I worked for. They had been pegged in the niche category of their Magic Quadrant for years. Over ht course of 12 months, I worked with the main analyst covering our space. I secured promotion from the Niche Quadrant to the Leaders Quadrant, without spending any money on analyst services or consulting. The number of RFPs that we were invited to participate in skyrocketed after that promotion.
4. Refresh & Expand Your Customer Stories
One reason Salesforcce.com is successful is that they provide over 300 customer success stories on their website. You should be constantly writing about your customers’ success. You should also actively encourage your customers to post their reviews on user review sites like Capterra, G2, and Software Advice. A huge red flag for prospective customers is when you have good success stories on your website, but those same stories cannot be found on the user review sites.
Jon Gatrell has some great advice:
If your company is in this kind of situation I have a plan that you could execute on your own to build and leverage credible proof points for your solutions.
“The core of this project is helping customers document and then promote their own success using your solutions. Everyone likes to have their horn tooted. By helping your key users or champions demonstrate the wisdom of their decision to acquire and deploy your solution you can create a win-win scenario. For lack of a better term I’ll call this a ‘Customer Success Program’. The goal of the program is to get 6 to 12 customers to participate in a study to document the business impact your product or service has had on their organization. The deliverables of the program will be individual case studies and a microsite or blog. While the customers who participate in the program can distribute the case study internally, as a vendor you will anonymize their identity in any external presentation of the information and only use summary information. This approach has two benefits. First, by creating a solid, fact-based analysis of the customer’s success you enable the key users and champions to tout their success inside of their company. By anonymizing their identities and using only summary information externally you can typically get over any of the typical hurdles customers have with public endorsements of your products and solutions.
Your real goal in this project is to develop 3 to 5 rock-solid proof points that you can make about your products and solutions. To make this work you’ll probably need to approach a pool of 30 to 40 customers, split up into three to four verticals. If you can get 6 to 10 customers to participate, you will have hit a home run. Also, you’ll need to identify inside of your organization who has the best personal relationship with the target customers and users – sales, professional services, customer services, etc. You will need to develop a basic survey instrument – situation assessment, business problem, decision-making criteria, hard and soft benefit categories, risks, and risk mitigation strategies. Leveraging your firm’s best personal contacts, ask for a brief teleconference with your targeted users/champions to explain the program and ask for participation. Emphasize that this is a fact-finding mission on how effective your product or service has been and that you are interested in learning how you can improve your offerings even further. Stress the anonymity in the use of any results from a marketing and sales perspective and emphasize the benefits of having a documented case study for internal consumption in the customer organization.
You will learn a lot of things in the execution of this kind of project. First, you will find out who inside of your company really does have good relationships with key people at your customer organizations. Second, you’ll learn that a lot of people are passionate about your technology and more than happy to share their experiences. Third, it is inevitable that you will learn some things about your product, services, and company that you did not want to hear but definitely need to be fixed. Finally, you will be able to harvest real fact-based information to support the proof points you need to effectively market and sell your solutions.”
Marketing Statistics Are Hard . . . Sometimes It’s Just Easier to Make Them Up”
Summary
Many SaaS product value equations are generic and undifferentiated. They lack credible proof points. There are steps product managers can take today to make sure their value equations don’t suck. They can refresh their messaging platforms, build ROI/Benefit calculators, refresh industry analyst relationships, and refresh and expand their customer stories. All of this is hard work, but worth the investment. Or they could just admit that marketing statistics are hard . . . sometimes it’s just easier to make them up.