Win/Loss Analysis for Series B SaaS CEOs: The Readiness Gap Nobody’s Closing
Why the funding stage with the highest win/loss readiness score is also the stage where most CEOs let the discipline slip — and what it costs them at the Series C table and beyond.
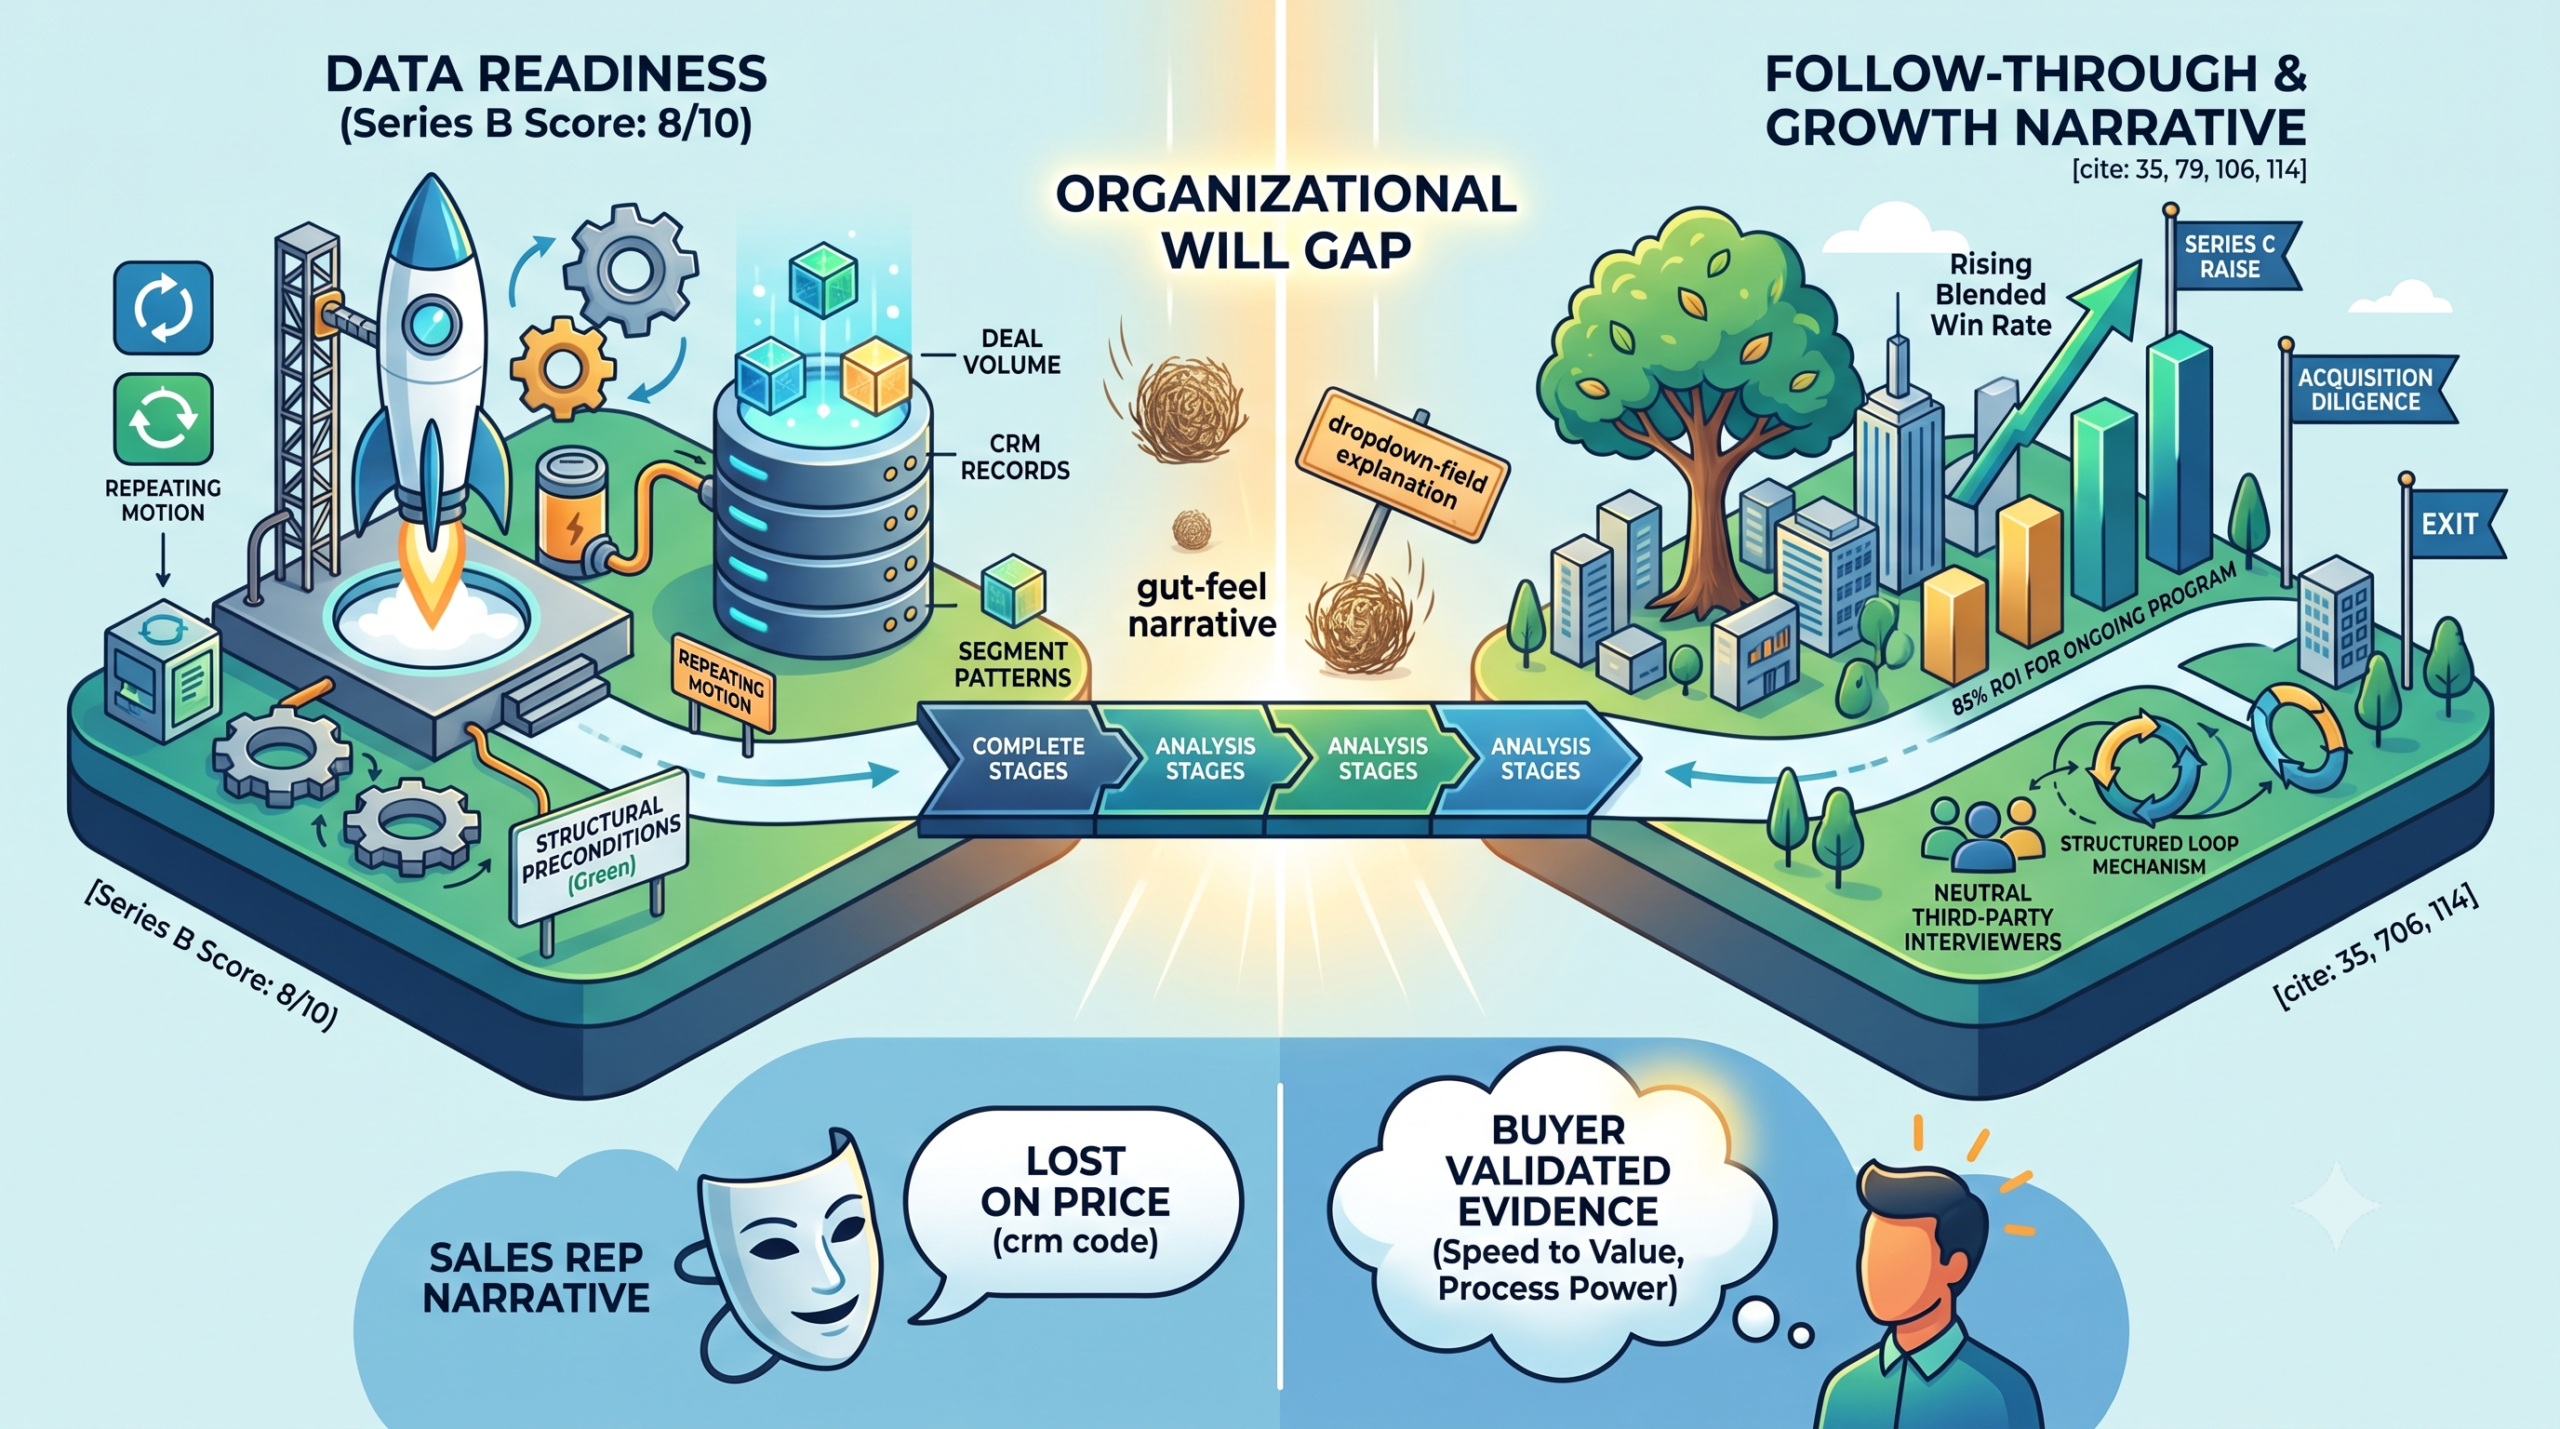
Win/loss analysis for Series B SaaS CEOs isn’t a nice-to-have GTM exercise — it’s the single highest-ROI diligence habit most Series B boards never formally request. Our proprietary readiness framework scores Series B an 8 out of 10, the highest of any funding stage. Deal volume is finally sufficient. CRM data has enough history to be useful. The board is asking sharper questions about win-rate plateaus and rising CAC. Every structural precondition for a rigorous win/loss program is in place.
And yet most Series B companies still run win/loss the way they did at seed: an occasional Slack thread after a big loss, a founder’s gut-feel narrative, a sales leader’s dropdown-field explanation nobody has verified. The gap between readiness and execution at this stage isn’t a data problem. It’s an organizational-will problem — and it’s expensive.
The Series B Paradox: Highest Readiness, Lowest Follow-Through
Our internal Win/Loss Readiness framework scores every funding stage from pre-seed through growth/pre-IPO on five factors: deal volume, data access, organizational will, resourcing, and actionability. Series B is the only stage that clears a GREEN rating on structural readiness while simultaneously carrying its own distinct adoption risk. The scaling motion is repeatable enough to generate meaningful sample sizes. Regional and segment specialization means you finally have enough closed-lost deals across ICP tiers — SMB, mid-market, enterprise — to see real patterns instead of anecdotes.
 through Growth/Pre-IPO (5, AMBER), with Series B scoring highest at 8, GREEN")
Figure 1: Series B posts the highest structural readiness score of any funding stage — the constraint shifts from data availability to organizational adoption.
Compare that to what we found when we mapped win/loss readiness for pre-seed and seed-stage SaaS companies: founders there are structurally blocked by thin deal volume, not organizational resistance. By Series B, that constraint has flipped. The table below shows the inflection clearly.
| Funding Stage | Readiness Score | RAG Status | Primary Driver |
|---|---|---|---|
| Series A | 7 | GREEN | Inflection point — playbook and hiring plan ROI |
| Series B | 8 | GREEN | Highest-value stage — organizational will is the constraint |
| Series C+ | 6 | AMBER | Needs tooling/ownership or execution quality slips |
The RAG rationale for Series B is blunt: this is the highest-value stage for win/loss analysis, and the main risk is organizational will and cross-functional adoption — not data availability. Sales leadership is often defensive about numbers tied to comp and promotion. Win/loss gets treated as a nice to have relative to pipeline generation. Findings surface in a QBR deck and then evaporate because no cross-functional owner exists to act on them.
| FOR PE/VC INVESTORSA Series B portfolio company with a GREEN-rated win/loss readiness score but no active program isn’t a data-availability problem on your next board call — it’s a governance gap. Ask when the last structured buyer interview happened, who owns the findings, and whether they changed a single line in the sales playbook. If the answer is vague, treat it as a diligence flag for the next round, not just a coaching note. |
Why Win Rates Plateau (and CAC Creeps) at Series B
Series B is where the GTM motion described in our analysis of the 2026 SaaS go-to-market playbook rewrite starts to strain under its own weight. You are no longer selling to friendly design partners. You are competing for mid-market and early-enterprise budget against named competitors, with a sales team that is half seasoned and half recently ramped.
The benchmark data on where win rates actually land at this stage is sobering, and it varies sharply by deal size. Enterprise deals above $100K ACV convert at roughly 12 to 18 percent, per an Optifai benchmark study of 939 B2B SaaS companies, while mid-market deals in the $10K–$50K range land closer to a 24 percent median. A separate 2025 Ebsta x Pavilion GTM benchmark analysis found blended B2B win rates falling to 19 percent, down from 29 percent the year before — a market-wide compression, not a company-specific failure, driven by longer buying cycles and more cautious procurement.
That compression matters enormously at Series B because the board narrative usually isn’t built to absorb it. Investors were sold a Series A growth story; Series B diligence increasingly interrogates win-rate plateaus and CAC increases directly, and the SVB data on Series B burn discipline shows boards have gotten far less tolerant of we’ll grow into it answers than they were in 2021 and 2022.
A falling win rate while revenue keeps growing isn’t good news — it means your pipeline is inflating faster than your team’s ability to close it. At Series B, that gap is exactly what boards start asking about.
| FOR SAAS FOUNDERS APPROACHING EXITThe win-rate story you tell your Series B board is a preview of the win-rate story an acquirer’s diligence team will eventually stress-test. Founders who can point to a documented win/loss program — not just a plausible narrative — walk into Series C and eventual exit conversations with evidence instead of anecdote. That distinction shows up in valuation conversations more often than founders expect. |
The Real Gap Thesis: What Your VP Sales Tells the Board vs. What Buyers Actually Say
Here is the uncomfortable finding underneath every Series B win-rate plateau: the internal narrative about why you lose deals is usually wrong, in a specific and measurable way. CRM disposition codes capture a single reason, reported by the seller, at the exact moment they are least motivated to be candid. Lost on price is the safe answer. I never understood their real requirements is the honest one that rarely gets typed into a dropdown.
The data on this gap is remarkably consistent across independent sources. Analysis drawing on Primary Intelligence’s dataset of more than 50,000 buyer interviews found that sales reps attribute losses to price 48 percent of the time — but buyers cite price as the actual primary factor only 23 percent of the time. A separate study of 10,247 buyer conversations from User Intuition found an even wider gap: 62.3 percent of buyers mention price initially, but only 18.1 percent were genuinely driven by it. That’s a 44-point gap between what buyers say first and what actually decided the deal.
 and User Intuition (62.3% vs 18.1%)")
Figure 2: Two independent buyer-interview datasets show the same pattern — reps over-attribute losses to price by roughly 2 to 3.4x relative to what buyers actually say drove the decision.
This is the same structural pattern we describe as the Gap Thesis in our M&A valuation work — the delta between what a vendor or a sales organization claims and what production data actually shows. At the M&A level, that gap shows up in AI vendor benchmark claims versus production reality. At the GTM level, inside your own Series B revenue org, it shows up as a VP of Sales narrative that has calcified around a comfortable, unverified explanation for why deals slip.
Anova Consulting Group, which has run thousands of post-decision buyer interviews over two decades, reports that sales reps lack a complete and accurate understanding of why they actually lost in 60 percent or more of cases. That’s not a competence problem. It’s a structural blind spot — the person closest to the deal has the least objective view of why it fell apart, and the strongest incentive to explain it away.
The Three Objections Your Sales Leadership Will Raise
If you propose a formal win/loss program at Series B, expect resistance from exactly the function whose numbers are under the microscope. Our readiness framework identifies three recurring objections at this stage, and each has a direct counter.
Objection 1: “This will be used to assign blame.”
Sales leadership hears win/loss program and assumes it’s a comp-review exercise wearing a research hat. The counter is structural, not rhetorical: use a neutral third-party or cross-functional interviewer — never the rep who owned the deal — and report findings in aggregate patterns, not deal-by-deal scorecards. The goal is a market signal, not a performance review.
Objection 2: “We’re too busy hitting quota to sit through interviews.”
This is a resourcing objection disguised as a priorities objection. It rarely requires a full-time hire. Even ten to fifteen structured interviews per quarter, run by a dedicated program owner — inside product marketing, RevOps, or an outside partner — produce statistically meaningful themes without pulling AEs off the phones.
Objection 3: “Findings never make it back into the playbook anyway.”
This is the most damaging objection because it’s usually true, and it’s an execution failure rather than a program-design failure. Findings need a forcing mechanism: a standing agenda slot in the quarterly sales kickoff, a battlecard refresh cadence, or a board-deck line item. Without a feedback loop, win/loss becomes a report nobody reads instead of a compounding asset.
Building a Series B Win/Loss Program: The Five-Step Framework
A Series B win/loss program doesn’t need to be elaborate to be effective. It needs to be structured, recurring, and owned. Five steps get most Series B companies from zero to a functioning program in a single quarter.
- Plan around a specific question. Don’t start with “tell us why we win and lose.” Start with a question the board is already asking — why did win rate drop 6 points in mid-market, or why is CAC payback stretching past 18 months — and design interviews to answer it.
- Recruit deliberately, across segments. Pull a representative mix of closed-won and closed-lost deals across your ICP tiers — SMB, mid-market, enterprise — not just the deals that are easiest to schedule.
- Interview with a neutral party. Whether that’s an internal RevOps or product marketing lead, or an outside firm, the interviewer must have no stake in the deal outcome. This is what separates a real win/loss program from a glorified customer-success check-in.
- Analyze against CRM data, not instead of it. Triangulate interview findings with CRM notes, call recordings, and product usage data. The interview tells you what buyers actually decided on; the CRM tells you what the deal looked like from the inside.
- Close the loop, visibly. Route findings into the sales playbook, competitive battlecards, and the board deck. Programs that distribute findings across departments — not just to sales — report measurably higher win-rate improvement than those that keep findings siloed.

Figure 3: Program structure matters more than program existence. Ongoing, cross-functional win/loss programs report positive ROI at roughly 1.5x the rate of one-off projects.
The maturity data backs up what the readiness framework predicts. The Clozd 2025 State of Win-Loss Analysis Report found that 63 percent of companies running win/loss programs report a win-rate increase, rising to 84 percent for programs that have run for two or more years. Eighty-five percent of ongoing, cross-functional programs report positive ROI, compared to just 55 percent of one-off, project-based efforts. Ninety-seven percent of companies already running a program plan to maintain or increase investment — a strong signal that once Series B companies push past the organizational-will barrier, the payoff is durable rather than marginal.
A Worked Example: Reading a Plateaued Win Rate
Consider a composite, illustrative example built from patterns common across Series B enterprise SaaS companies. A vertical SaaS company at $9M ARR sees its blended win rate slide from 27 percent to 19 percent over two quarters, while average deal size and sales cycle length both stay roughly flat. The VP of Sales tells the board the obvious story: competitors have gotten more aggressive on price, and the team needs another point of discount authority to stay competitive.
A structured win/loss program built around the five-step framework above would test that narrative directly rather than accept it. Fifteen interviews are scheduled across closed-won and closed-lost deals from the two affected quarters, split evenly across mid-market and enterprise segments, and run by a neutral RevOps lead rather than the account executives who owned the deals.
In a plausible version of this scenario, the interviews would surface a pattern the CRM data alone never would: price is mentioned early in most conversations, consistent with the attribution-gap data above, but the actual decisive factor in a majority of the losses is a new mid-market competitor’s faster proof-of-concept turnaround — five business days versus the target company’s three-week implementation timeline for a pilot. Buyers weren’t choosing based on price. They were choosing based on speed to value, and the sales team’s instinctive read on more discount authority would have addressed the wrong variable entirely.
That is the value a formal program delivers that a plausible board narrative cannot: a testable, buyer-sourced explanation that changes the actual remediation plan. In this scenario, the fix is a compressed POC packaging option and a battlecard update — not a pricing concession that compresses margin without addressing the real cause of the lost deals. This is precisely the kind of finding that a rep-reported CRM field, built around a self-protective lost on price disposition code, would never surface on its own.
Common Mistakes Series B CEOs Make With Win/Loss Analysis
- Outsourcing the narrative to the VP of Sales without independent verification. If the same function whose performance is being measured is also the sole source of the loss explanation, you’ve reproduced the attribution gap inside your own board deck.
- Running a single burst of interviews and calling it done. A one-time project generates a snapshot. Trends — the kind that actually explain a win-rate plateau — require an ongoing cadence.
- Treating win/loss as a sales-only initiative. Product, marketing, customer success, and even engineering all have a stake in what buyers say about why they walked away. Programs that stay siloed inside sales lose most of their organizational value.
- Skipping the CRM triangulation step. Interview data without CRM context tells you what buyers say, not whether it’s representative of the broader pipeline. Both data sources are necessary; neither is sufficient alone.
- Letting findings die in a quarterly deck. Without a standing mechanism to update the playbook, refresh battlecards, or brief the board, even excellent findings decay into an unread PDF within two quarters.
From GTM Signal to M&A Asset: Why This Data Matters Beyond the Board Deck
Here is the piece most Series B CEOs miss entirely. A documented win/loss program isn’t just a sales-efficiency tool — it’s a diligence asset that compounds in value the longer you run it. Crunchbase data shows only 42 percent of Series B companies raise a Series C, and CB Insights research shows 67 percent of Series A companies never reach Series B at all. The companies that clear each gate disproportionately share one trait: they can explain their numbers with evidence, not narrative.
This connects directly to the moat question we explore in our Seven Powers-based SaaS Moat Scorecard. Hamilton Helmer’s framework treats process power — documented, compounding organizational knowledge — as one of seven durable sources of competitive advantage. A win/loss program that has run for two-plus years is a textbook process-power asset: it’s difficult for a competitor to replicate quickly, and it produces evidence a diligence team can actually verify, rather than a claim they have to take on faith.
It also matters for the margin story your Series B metrics will eventually tell. Our analysis of 2026 SaaS cost-cutting and margin composition shows that acquirers and lenders increasingly decompose EBITDA improvement to distinguish genuine GTM efficiency from a temporary sales-and-marketing retrenchment. A CEO who can point to a specific, buyer-validated reason for a win-rate improvement — not just a smaller S&M line — is telling a fundamentally more credible growth-efficiency story than one who can’t.
The uncomfortable version of this argument: if you are not running a structured win/loss program by Series B, you are not just leaving a GTM efficiency gain on the table. You are entering your Series C raise, and eventually a strategic exit process, with the same unverified narrative your VP of Sales has been telling your board all along — except now the person asking the questions is an acquirer’s diligence team, not a friendly investor.
| FOR ENTERPRISE CTOs / CPOsWin/loss interviews surface a specific category of finding that rarely reaches product leadership through any other channel: the feature gap that cost a deal but never became a support ticket or a customer-success escalation. Requesting a standing product-relevant findings summary from your revenue org’s win/loss program — even if you don’t own it — closes a blind spot most technical leaders don’t know they have. |
Frequently Asked Questions
How many win/loss interviews do we need to see a meaningful pattern at Series B?
Ten to fifteen interviews per quarter, split across your major ICP segments, is generally enough to surface real themes at Series B deal volumes. You don’t need statistical significance in the academic sense — you need enough consistency across independent conversations to distinguish a pattern from a single disgruntled buyer.
Should win/loss analysis be owned by sales, marketing, or product?
Product marketing is the most common home for the program, precisely because it sits between the functions that need the findings and has no direct stake in the deal outcomes being examined. Whoever owns it, the interviewer must be someone other than the rep who ran the deal.
Is it worth hiring an outside firm instead of running win/loss internally?
Third-party interviewers generally get more candid responses, particularly on lost deals, because buyers are more willing to be direct with someone outside the vendor relationship. For Series B companies without a dedicated internal owner, an outside partner is often the faster path to a program that actually runs on a consistent cadence rather than falling apart after one quarter.
What’s the single biggest sign our win/loss program is underperforming?
Findings that never change a battlecard, a pricing page, or a board deck. A program can run interviews faithfully every quarter and still fail if there’s no mechanism forcing the findings back into the GTM motion. Measure the program by what changed, not by how many interviews were completed.
Series B is the stage where win/loss analysis has the best odds of working — enough deal volume, enough data quality, enough board attention to justify the investment. It’s also the stage where most companies let it slide, because the organizational resistance is real and the near-term pressure to just hit the number is louder than the long-term case for rigor.
The CEOs who push through that resistance get two things at once: a sharper, faster-improving GTM motion today, and a documented, defensible growth-efficiency narrative for the Series C raise or exit process ahead. The readiness score says you’re ready. The follow-through is a choice.
DevelopmentCorporate LLC runs independent Win/Loss Analysis Programs for enterprise SaaS companies from Series A through pre-IPO, alongside board and fundraising narrative advisory. If your Series B win-rate story needs a buyer-validated foundation before your next board meeting or your next raise, book a 15-minute call to discuss what a structured program would look like for your stage and deal volume.