Product Managers: How Can You Estimate Your Competitor’s Product Line Revenues?
Understanding your competitors’ product line revenues is critical. Revenue information helps to put the relative strength or weakness of a competitor into the proper context. It helps product managers to make the best decisions about priorities, investment, and focus. It is relatively straightforward to understand the total revenues of competitors. Public companies are required to file periodic reports with regulatory agencies like the SEC containing audited financial statements. There is no SECgov where you can find financial statements for privately held companies. There are a number of techniques you can use to estimate a private company’s total revenues. Determining the specific product line revenues for public and private companies is tough. Public companies sometimes disclose product-level revenues, privately-held companies rarely do. But there are some techniques you can use to build order-of-magnitude estimates.
In this article we will discuss:
- Why Is Understanding Competitor Product Line Revenues Important?
- How to Estimate Product Line Revenues of a Public SaaS Company
- 10-K, 10-Q, and Annual Reports
- Investor Presentations
- How to Estimate the Total Revenues of a Private Company
- Use Google
- Latka.com
- Owler.com
- Growjo.com
- Headcount Proxy
- How to Estimate a Private Company’s Product Line Revenues
- Build a Product Line Revenue Framework
- Gather Evidence of Product Line Revenues
- Sanity Check with Corporate Development Professionals or Other Industry Experts
- Test Case: Estimate Your Company’s Product Line Revenues
Why Is Understanding Competitor Product Line Revenues Important?
SaaS product revenues are important. Revenue is the best metric for describing the relative success of a product in the marketplace. A simple example is Microsoft Bing search versus Google search revenue. In 2020, Bing generated $7.74 billion in revenue. Google search generated $104 billion in revenue. DuckDuckGo, the privacy-focused search engine generated approximately $100 million of revenue in 2020. These facts help product managers at Microsft, Google, and DuckDuckGo make the best decisions they can about how to prioritize investments to achieve their company’s goals.
Understanding your competitors’ product line revenues is critical. Many SaaS companies suffer from what is called the disproportionate impact effect. The disproportionate impact effect is when someone takes a competitor’s actions (or inactions) out of context and demands a change to your company’s strategies or tactics. For example, consider the scenario when a salesperson loses a deal to a competitor. They hear a rumor that the reason why they lost is that the competitor could afford to cut their prices dramatically to win the deal. The rumor might be true, or false. If a product manager knew that the competitor’s product had been losing revenues for two years in a row they could recognize that the competitor’s pricing for a specific deal might be more of an act of desperation than a viable strategy your firm should adopt. Some companies intentionally try and sabotage their competitors by launching disproportionate impact tactics against their competitors.
Understanding competitors’ product line revenues help you to put their strategies, as well as your company’s strategies, into the proper context. For example, the explanation of a competitor extremely discounting their products might be due to another reason. If the competitor just raised a lot of venture capital or private equity funding, they may have adopted a strategy to gain as much market share as possible as quickly as they can. Your firm may never be able to compete on price. You will have to find other ways to differentiate your products and justify the return on investment for customers.
How to Estimate Product Line Revenues of a Public SaaS Company
Public software companies are required to file periodic reports with regulatory agencies like the SEC, the Companies House in the UK, or the Australian Stock Exchange (ASX) in Australia. Audited financial statements (Income Statement, Balance Sheet, and Cash Flow Statements) must be filed on a timely basis. In the U.S. the most common filings are 10-K (Annual Reports), 10-Q (Quarterly Reports), and S-1 (Initial Registration Statement). If you need more information on how to read and understand these statements check out Why Product Managers Need to be Able to Read 10-K Filings, Why Should Product Managers Care About Income Statements?, Why Should Product Managers Care About Balance Sheets? and Why Product Managers Should Care About Cash Flow Statements. One of the important things about public filings is that they must be complete, accurate, and factual. There can be significant penalties for publishing inaccurate or misleading information.
10-K, 10-Q, and Annual Reports
Some public SaaS companies report product line revenues. Here is an excerpt from Google’s 2020 10-K report:

Reports like 10-Ks and 10-Qs contain not only audited financial statements, but management’s discussion of what has occurred. There is a standard section in each 10-K/10-Q named Item 7. Management’s Discussion And Analysis Of Financial Condition And Results Of Operations. The management discussion helps you to understand why revenues are growing or declining.
Here is an excerpt from Google’s 2020 10-K:
Trends in Our Business
The following trends have contributed to the results of our consolidated operations, and we anticipate that they will continue to affect our future results:
Users’ behaviors and advertising continue to shift online as the digital economy evolves.
The continuing shift from an offline to online world has contributed to the growth of our business since inception, contributing to revenue growth, and we expect that this online shift will continue to benefit our business.
Users are increasingly using diverse devices and modalities to access our products and services, and our advertising revenues are increasingly coming from new formats.
Our users are accessing the Internet via diverse devices and modalities, such as smartphones, wearables and smart home devices, and want to feel connected no matter where they are or what they are doing. We seek to expand our products and services to stay in front of these trends in order to maintain and grow our business.
We generate our advertising revenues increasingly from different channels, including mobile, and newer advertising formats, and the margins from the advertising revenues from these channels and newer products have generally been lower than those from traditional desktop search. Additionally, as the market for a particular device type or modality matures our revenues may be affected. For example, growth in the global smartphone market has slowed due to various factors, including increased market saturation in developed countries, which can affect our mobile advertising revenue growth rates.
We expect TAC paid to our distribution partners to increase as our revenues grow and to be affected by changes in device mix; geographic mix; partner mix; partner agreement terms; and the percentage of queries channeled through paid access points.
We expect these trends to continue to put pressure on our overall margins and affect our revenue growth rates.
As online advertising evolves, we continue to expand our product offerings which may affect our monetization.
As interactions between users and advertisers change and as online user behavior evolves, we continue to expand and evolve our product offerings to serve their changing needs. Over time, we expect our monetization trends to fluctuate. For example, we have seen an increase in YouTube engagement ads, which monetize at a lower rate than traditional search ads.
As users in developing economies increasingly come online, our revenues from international markets continue to increase and movements in foreign exchange rates affect such revenues.
The shift to online, as well as the advent of the multi-device world, has brought opportunities outside of the U.S., including in emerging markets, and we continue to develop localized versions of our products and relevant advertising programs useful to our users in these markets. This has led to a trend of increased revenues from international markets over time and we expect that our results will continue to be affected by our performance in these markets, particularly as low-cost mobile devices become more available. This trend could impact our margins as developing markets initially monetize at a lower rate than more mature markets.
Our international revenues represent a significant portion of our revenues and are subject to fluctuations in foreign currency exchange rates relative to the U.S. dollar. While we have a foreign exchange risk management program designed to reduce our exposure to these fluctuations, this program does not fully offset their effect on our revenues and earnings.
The portion of our revenues that we derive from non-advertising revenues is increasing and may affect margins.
Non-advertising revenues have grown over time. We expect this trend to continue as we focus on expanding our offerings to our users through products and services like Google Cloud, Google Play, hardware products, and YouTube subscriptions. Across these initiatives, we currently derive non-advertising revenues primarily from sales of apps, in-app purchases, digital content products, and hardware; and licensing and service fees, including fees received for Google Cloud offerings and subscription and other services. The margins on these revenues vary significantly and may be lower than the margins on our advertising revenues. A number of our Other Bets initiatives are in their initial development stages, and as such, the sources of revenues from these businesses could change over time and the revenues could be volatile.
As we continue to serve our users and expand our businesses, we will invest heavily in operating and capital expenditures.
We continue to make significant R&D investments in areas of strategic focus such as advertising, cloud, machine learning, and search, as well as in new products and services. In addition, our capital expenditures have grown over the last several years. We expect this trend to continue in the long term as we invest heavily in land and buildings for data centers and offices, and information technology infrastructure, which includes servers and network equipment.
In addition, acquisitions remain an important part of our strategy and use of capital, and we expect to continue to spend cash on acquisitions and other investments. These acquisitions generally enhance the breadth and depth of our offerings, as well as expand our expertise in engineering and other functional areas.
Most public SaaS companies only report revenues in a summary manner. I have been an executive for three different public software companies – only one of them reported revenues n a product line basis. They were eager to show that their core revenues were growing, while their ‘legacy’ revenues were declining.
Investor Presentations
Sometimes public companies reveal more information in presentations they make to stockholders or at investor conferences. For example, I recently studied a public Australian SaaS company in the sales enablement market – Bigtincan. While they disclosed total revenues in their audited financial statements, they provided a lot more detail in their annual investor presentation: By piecing together the information contained in the presentation it was possible to determine their product line revenues:
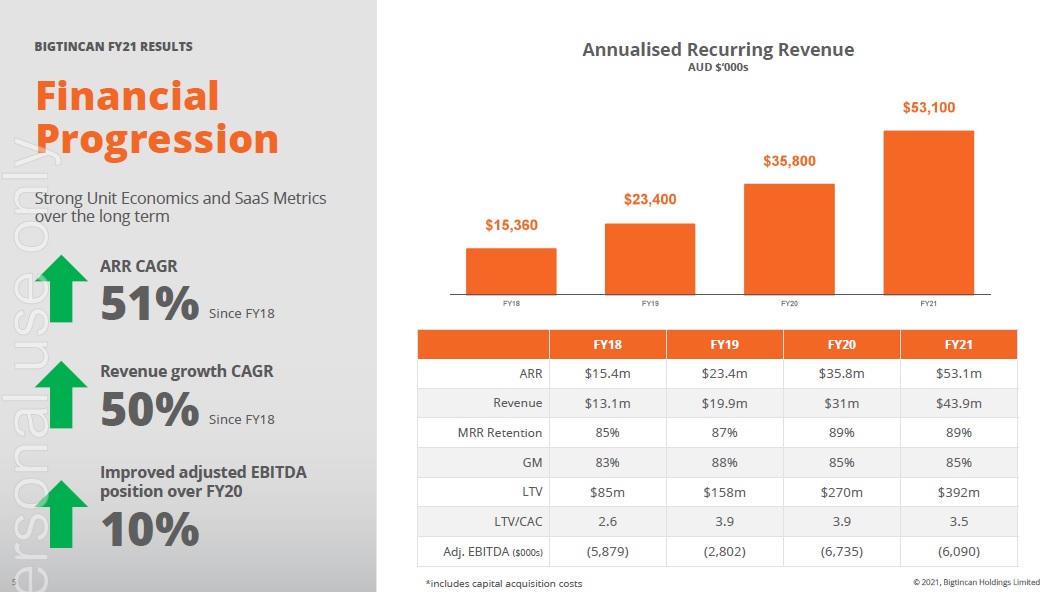
Bigtincan Annual Report to Shareholders

Bigtincan Annual Report to Shareholders
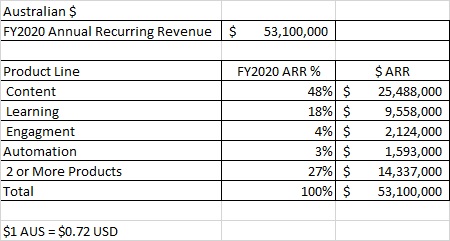
Regrettably, product line revenue reporting is more the exception than the rule when it comes to public SaaS companies. If you cannot find any detailed information you can use the approaches described in the next section on How to Estimate Product Line Revenues of a Private Company.
How to Estimate the Total Revenues of a Private Company
Estimating product line revenues for a private company is hard. The best you can do is develop a broad estimate – there can be significant variances between your estimate and the actual revenues +/-50%. You always have to balance the effort required to investigate revenues against the benefit of having the data. There are a number of tactics you can use to quickly see if there is information you can leverage. First, you need to estimate a company’s total revenues. Next, you can build estimates of how much revenue is associated with a specific product line.
Use Google
Google search is the best place to start. Consider the following Google query:

Structure your query as Company Name + Product Line + Year. If there is relevant info available, it will show up in the top results. Remember to always assess the credibility and biases of any search result.
Latka.com
Latka is a subscription service that provides a ton of information about SaaS companies. Examples of what Latka can provide include:

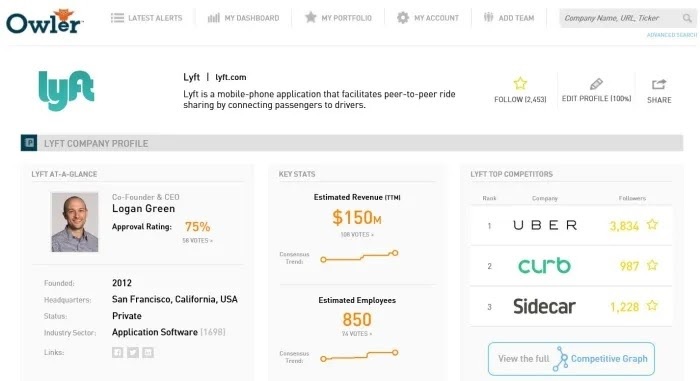
Owler.com
Owler is a crowd-sourced research site that provides overviews of private companies, including revenue estimates. They offer a limited free plan and two paid plans. Here is an example of an Owler summary:
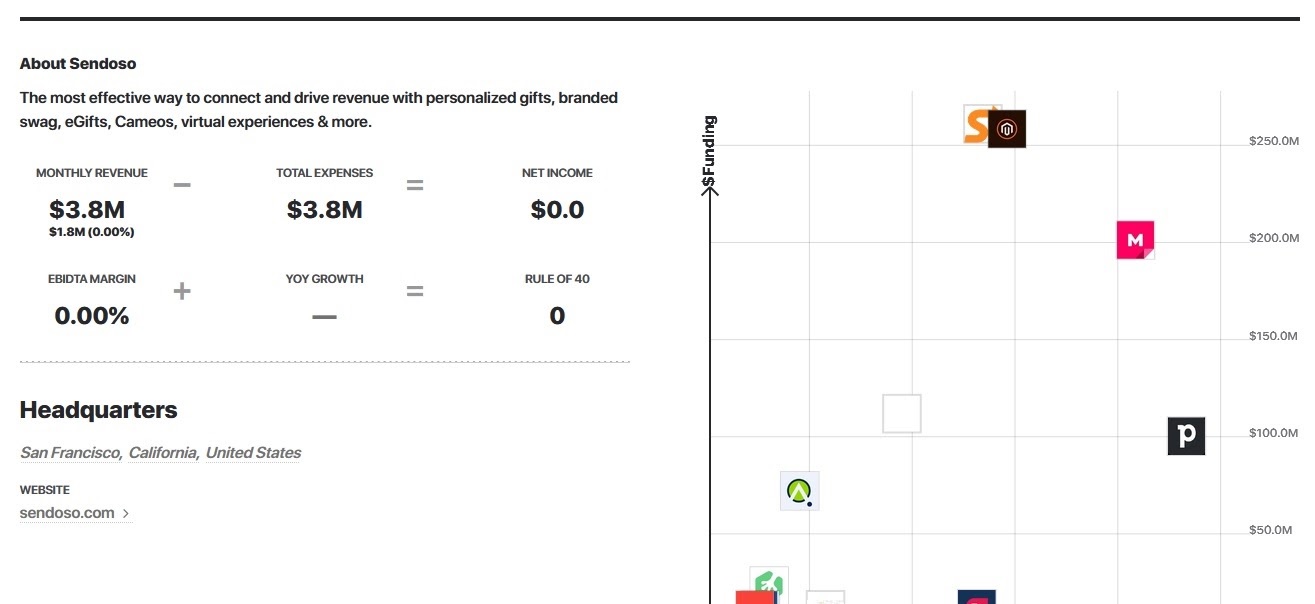
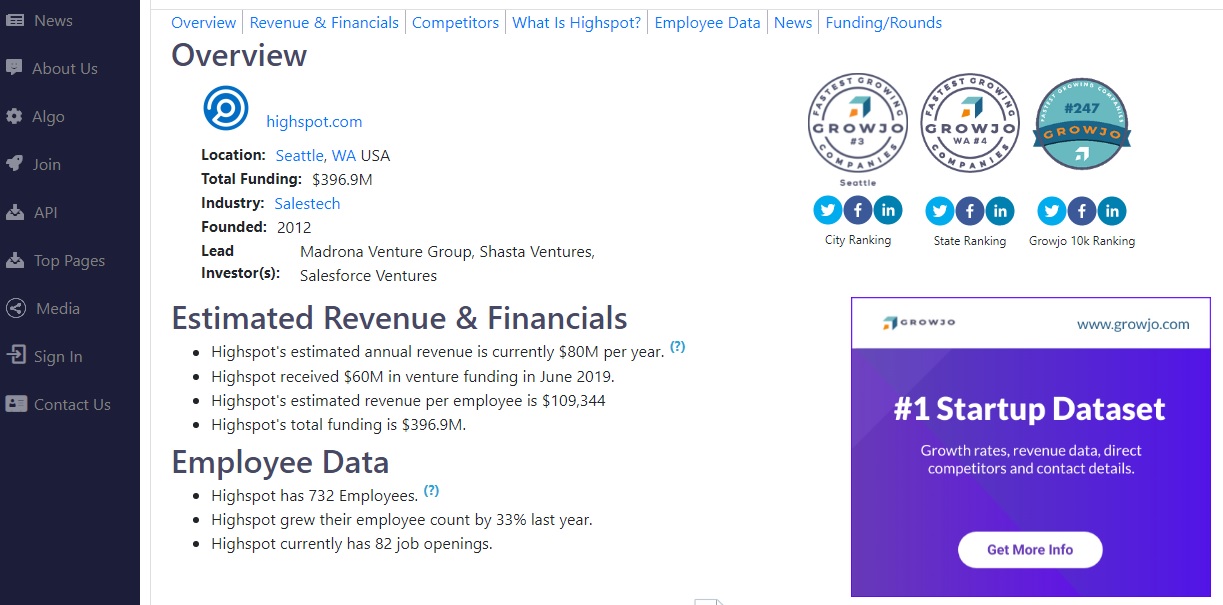
Growjo.com
Growjo is another aggregator of information about SaaS companies. It is a free resource. Here is the type of information you can find:

Headcount Proxy
If none of these sources yield any results you can use a technique known as the headcount proxy. Companies that are in the same industry tend to have similar ratios of revenue/headcount and operating income/headcount. You can examine the filings of public companies to determine a range of revenue/headcount ratios and then apply that to the competitor you are studying. In every 10-K Annual Report there is a section that lists the total number of employees.
To estimate the revenue for the private company, find the total employee count (LinkedIn, Owler, or Crunchbase) and apply the Revenue/Headcount ratio from your analysis.
Here is an analysis that I developed for a recent assignment on the sales enablement technology market:

Headcount proxy analyses are very broad estimates but are usually accurate within +/- 25%
How to Estimate a Private Company’s Product Line Revenues
Estimating product line revenues for private companies is very hard. Unless the company has only one product line, you will have to make broad estimates based on the evidence you gather from multiple sources.
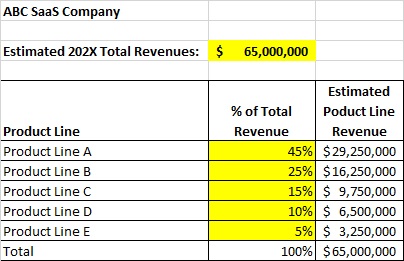
Build a Product Line Revenue Framework
To start, build a simple model to describe the relative share of total revenues each product line contributes.
Gather Evidence of Product Line Revenues
Next, scour the web for information about potential product line revenues. For example:
- Google search for [ABC SaaS Company Product Line X 2020 Revenues]
- Review vendor press releases
- Review industry analyst reports that talk about vendor market shares
- Review industry market sizing reports
- Review use review sites like G2.com, Capterra, and SoftwareAdvice
As with any kind of Internet research, carefully consider the credibility of any information source you discover. Remember, determining product line revenues for private companies is just an estimation exercise at best. While total revenue estimates may be reasonably accurate, product line estimates are just that – estimates.
Sanity Check with Corporate Development Professionals or Other Industry Experts
Most companies have an executive that focuses on mergers & acquisitions. This person typically has access to all types of industry and competitor information. Most of the data is subject to Non-Disclosure Agreements, but you can ask these executives if your estimates seem ‘reasonable’. You can also ask them for any publicly available information that might be useful to you. I was a senior executive responsible for M&A for several public software companies as well as venture and private equity-based firms. At one point I had over 500 detailed profiles of competitors and other firms we were interested in. Where I could, I readily shared my data to help product teams in their work.
Test Case: Estimate Your Company’s Product Line Revenues
If you are like most product managers, you do not have access to actual product line revenue data. As a test, try and estimate your company’s product line revenues. Use the techniques described in this article and see what you can discover. Share the results with your VP and see how accurate, or inaccurate your estimates are.
Summary
Understanding your competitors’ product line revenues is critical. Revenue information helps to put the relative strength or weakness of a competitor into the proper context. It helps product managers to make the best decisions about priorities, investment, and focus. It is relatively straightforward to understand the total revenues of competitors. Public companies are required to file periodic reports with regulatory agencies like the SEC containing audited financial statements. There is no SECgov where you can find financial statements for privately held companies. There are a number of techniques you can use to estimate a private company’s total revenues. Determining the specific product line revenues for public and private companies is tough. Public companies sometimes disclose product-level revenues, privately-held companies rarely do. But there are some techniques you can use to build order-of-magnitude estimates.
If you would like more information or help finding competitor revenues or product line reveninues, send me an email at john.mecke@developmentcorporate.com.