Product Managers: Build a Competitor Revenue/Headcount/VC Funding Market Map
Two of my favorite books on software business strategy are Geoffrey Moore’s Crossing the Chasm and The Gorilla Game. I’ve led product management organizations for several large enterprise software firms. I’ve worked for Gorillas, Chimps, and regrettably even Monkeys. A constant challenge my teams faced was filtering out the noise from the important signals generated by our competitors. Our sales team would get up in arms over a perceived issue raised by a competitor in a sales cycle. One thing that helped was the ability to put all the competitors into context by building a market map. Product managers should build a competitor revenue / headcount / VC funding / Enterprise Value market map.
This article will cover:
- Why Product Managers Need a Competitor Revenue / Headcount/ VC Funding Market Map
- A Market Map Example
- How to Build a Competitor Revenue/Headcount/VC Funding Market Map
- Adding Public Company Competitors to Market Map
- Revenues
- # of Employees
- Enterprise Value
- Adding Privately-Held Company Competitors to Market Map
- Latka.com
- Owler.com
- Growjo.com
- Headcount Proxy
- Adding Public Company Competitors to Market Map
- Recap
Why Product Managers Need a Competitor Revenue / Headcount/ VC Funding Market Map
The market map describes the competitors’ revenues, headcount, VC funding (if any), and enterprise value (if the competitor is a public company). The map helps to put in perspective the size of a competitor, the scale of its ability to execute, and the scale of resources they have at their disposal. Such a map helps product managers have fact-based discussions with their organization about their competitors and your company’s position in the market.
Learning about competitors’ revenue, headcount, VC funding, and even enterprise value can sharpen product managers’ research skills and increase their overall financial literacy.
A Market Map Example
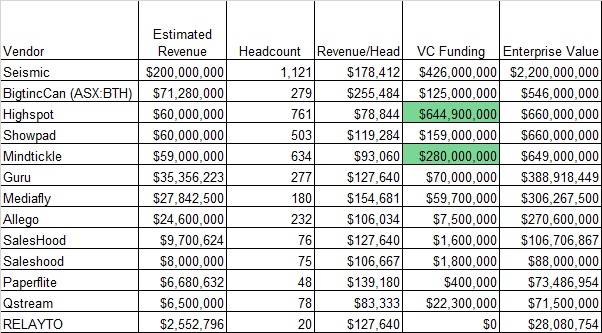
I recently worked n a project in the Sales Enablement tools space. Sales enablement tools help create, catalog, distribute, and analyze the performance of sales content like presentations, videos, and podcasts. Sales enablement tools also provide the ability to deliver sales training courses and analyze sales reps’ performance using conversational intelligence tools like Gong.io. Think SharePoint, but on steroids. Part of the project was building an initial competitor market map. Here is what we built:

The map helped put all of the vendors into perspective. It also highlighted how two of the vendors had recently raised a combined $300 million in new funding. These basic facts about revenue, headcount, and funding helped the team better explain to the organization who were the gorillas in the market, and who were the chimps
How to Build a Competitor Revenue/Headcount/VC Funding Market Map
The process to build a market map like this is pretty straightforward. There is one process for competitors who are publicly-traded companies, another one for privately-held ones.
Adding Public Company Competitors to Market Map
Public software companies are required to file periodic reports with regulatory agencies like the SEC, the Companies House in the UK, or the Australian Stock Exchange (ASX) in Australia. Audited financial statements (Income Statement, Balance Sheet, and Cash Flow Statements) must be filed on a timely basis. In the U.S. the most common filings are 10-K (Annual Reports), 10-Q (Quarterly Reports), and S-1 (Initial Registration Statement). If you need more information on how to read and understand these statements check out Why Product Managers Need to be Able to Read 10-K Filings, Why Should Product Managers Care About Income Statements?, Why Should Product Managers Care About Balance Sheets? and Why Product Managers Should Care About Cash Flow Statements. One of the important things about public filings is that they must be complete, accurate, and factual. There can be significant penalties for publishing inaccurate or misleading information.
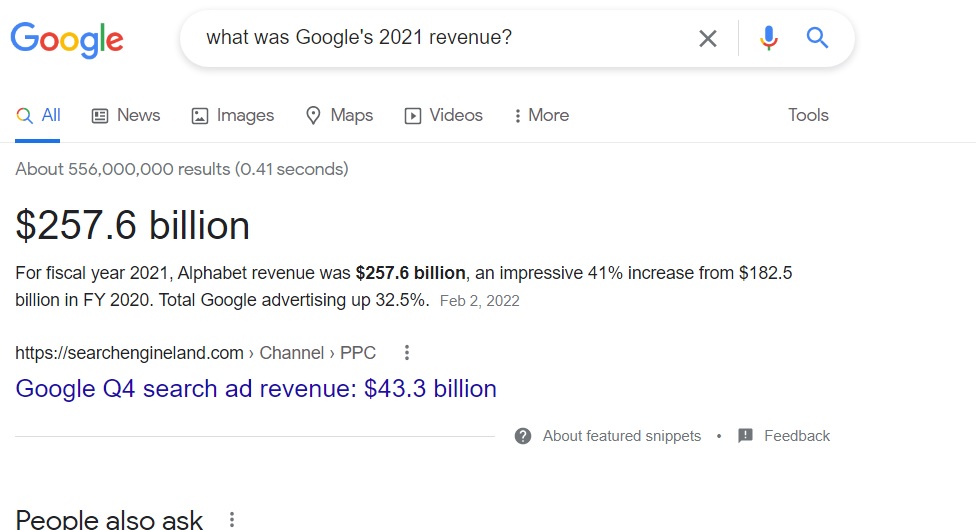
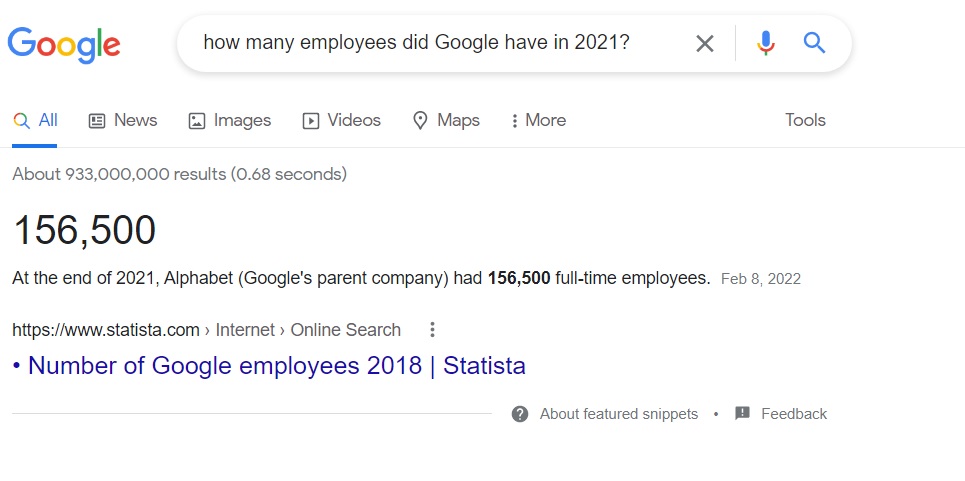
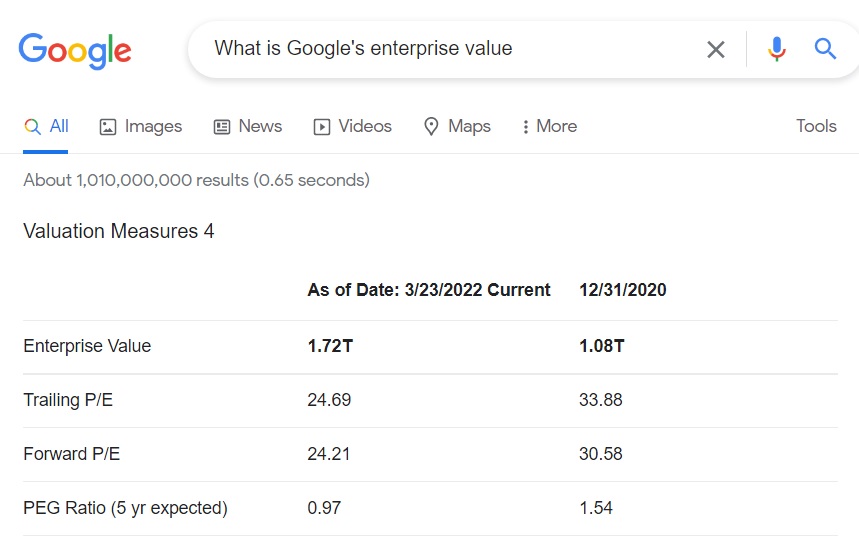
Because these filings are available electronically, Google makes it easy to find the facts you need to add to the market map. For example:
Revenues
# of Employees
Enterprise Value
If you really want to dig into product manager financial literacy, here are some articles that could help:
Why Product Managers Need Financial Literacy. SaaS product managers need more than what they learned in school
Why Should Product Managers Care About Income Statements? There’s more to them than what they taught you in business school.
Why Should Product Managers Care About Balance Sheets? Deferred revenue and goodwill impairments could kill your product.
Why Product Managers Should Care About Cash Flow Statements? They cut through the complex nature of actual accounting
Why Product Managers Need to be Able to Read 10-K Filings. They’re a goldmine of data about customers and competitors
DevelopmentCorporate also offers a three-day, 12-hour virtual workshop as well.
Adding Privately-Held Company Competitors to Market Map
Unfortunately, there is no SEC.gov for business information about privately held companies. The Google search techniques outlined above for public companies can work for many privately-held companies as well. Additionally, there are free services like Latka.com. Owler.com. GrowJo.com, LinkedIn, and CrunchBase.com can provide you with the facts you need for your market map. Finally, there is a technique known as the Headcount proxy that can be used to estimate revenues if all else fails. Here are some examples:
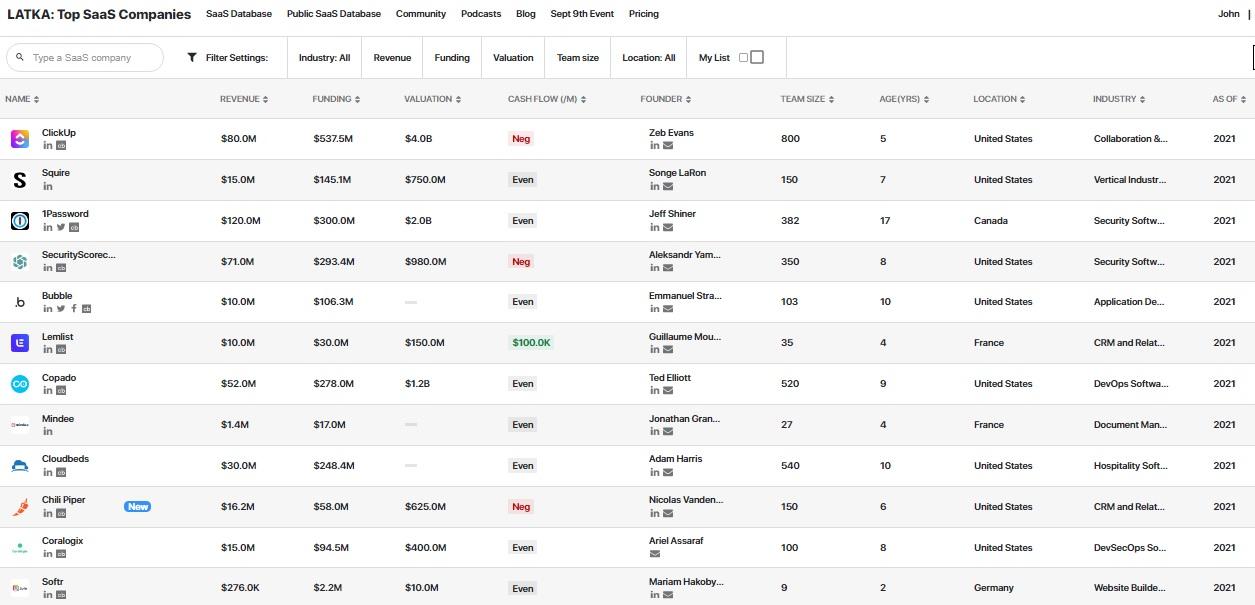
Latka.com
Latka is a subscription service that provides a ton of information about SaaS companies. Examples of what Latka can provide include:

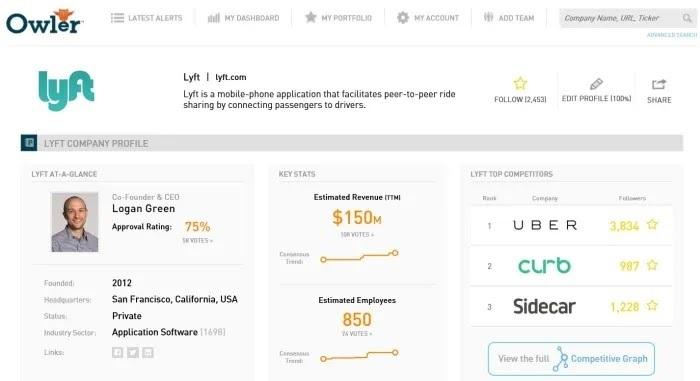
Owler.com
Owler is a crowd-sourced research site that provides overviews of private companies, including revenue estimates. They offer a limited free plan and two paid plans. Here is an example of an Owler summary:
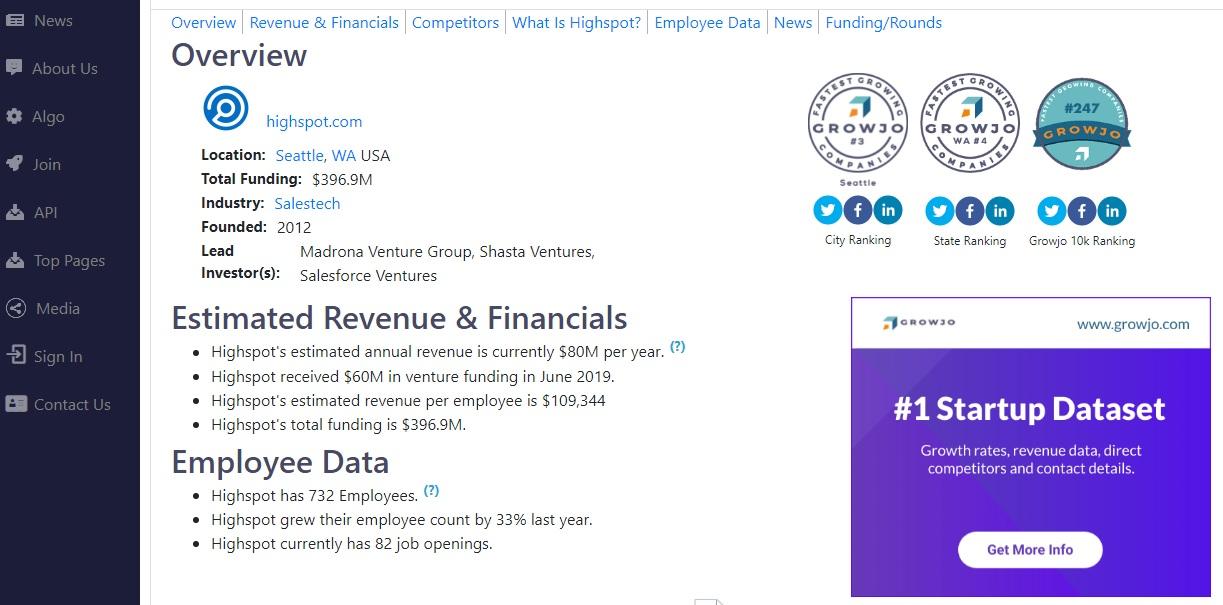
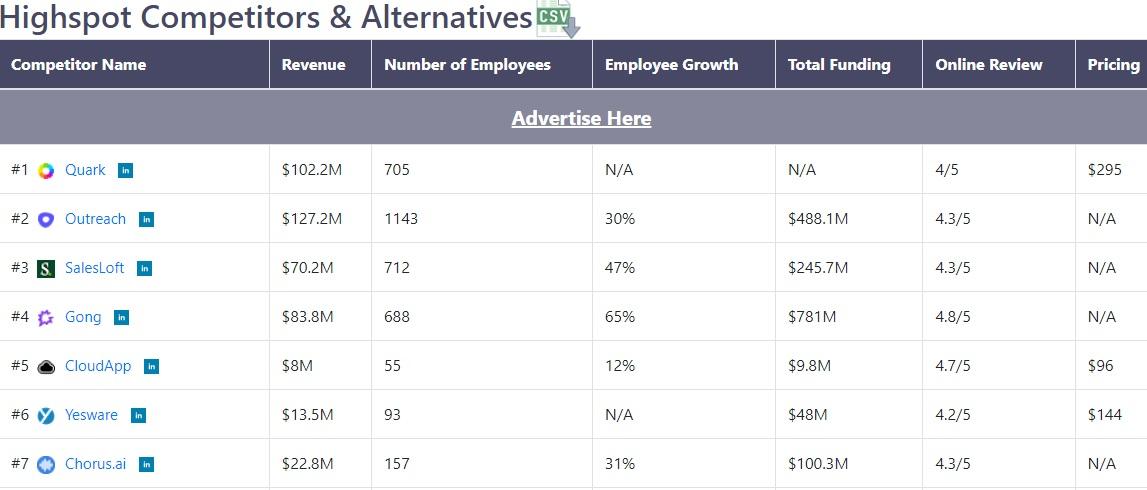
Growjo.com
Growjo is another aggregator of information about SaaS companies. It is a free resource. Here is the type of information you can find:
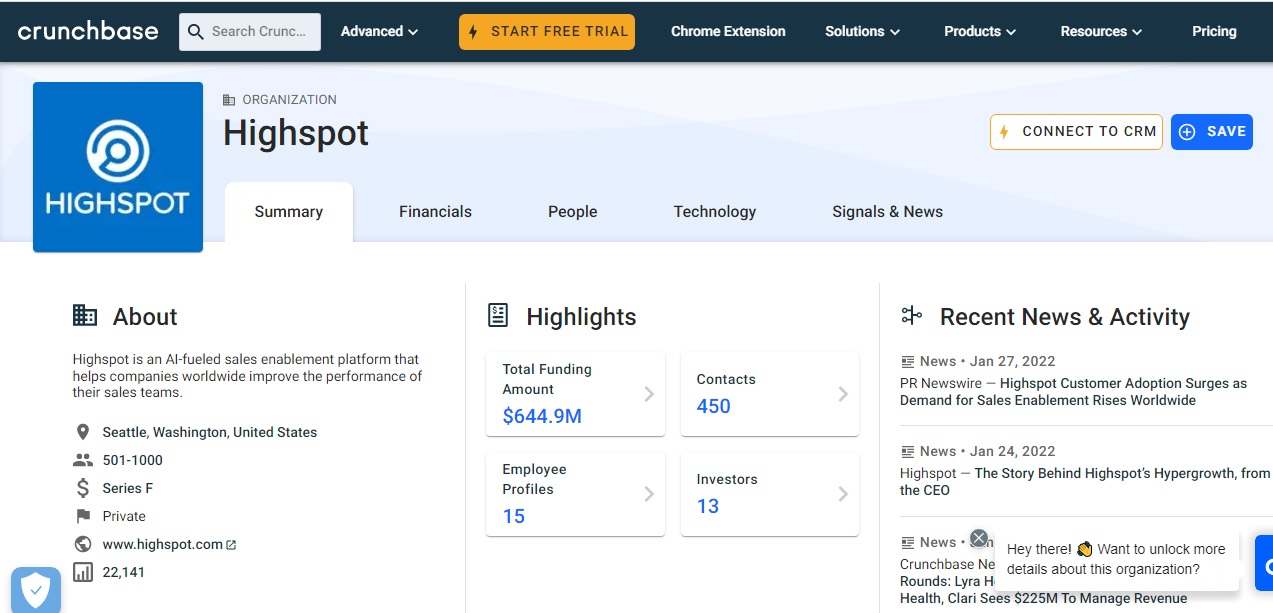
CrunchBase
Crunchbase is another data aggregator that is especially focused on VC-backed companies. You can use it to get insights into a competitor’s VC funding
Headcount Proxy
If none of these sources yield any results you can use a technique known as the headcount proxy. Companies that are in the same industry tend to have similar ratios of revenue/headcount and operating income/headcount. You can examine the filings of public companies to determine a range of revenue/headcount ratios and then apply that to the competitor you are studying. In every 10-K Annual Report, there is a section that lists the total number of employees.
To estimate the revenue for the private company, find the total employee count (LinkedIn, Owler, or Crunchbase) and apply the Revenue/Headcount ratio from your analysis.
Here is an analysis that I developed for a recent assignment on the sales enablement technology market:
Headcount proxy analyses are very broad estimates but are usually accurate within +/- 25%
Recap
Separating the noise from signals in regard to competitors is a challenge product managers face everyday. A market map of competitor revenues, headcount, VC funding, and enterprise value can help bring a fact-based perspective to those discussions. A market map can be built quickly using a multitude of free resources.
If you’ve liked what I’ve written, buy me a cup of coffee https://ko-fi.com/johnmecke