AI COGS: The Hidden Margin Tax Every SaaS CEO Must Map Now
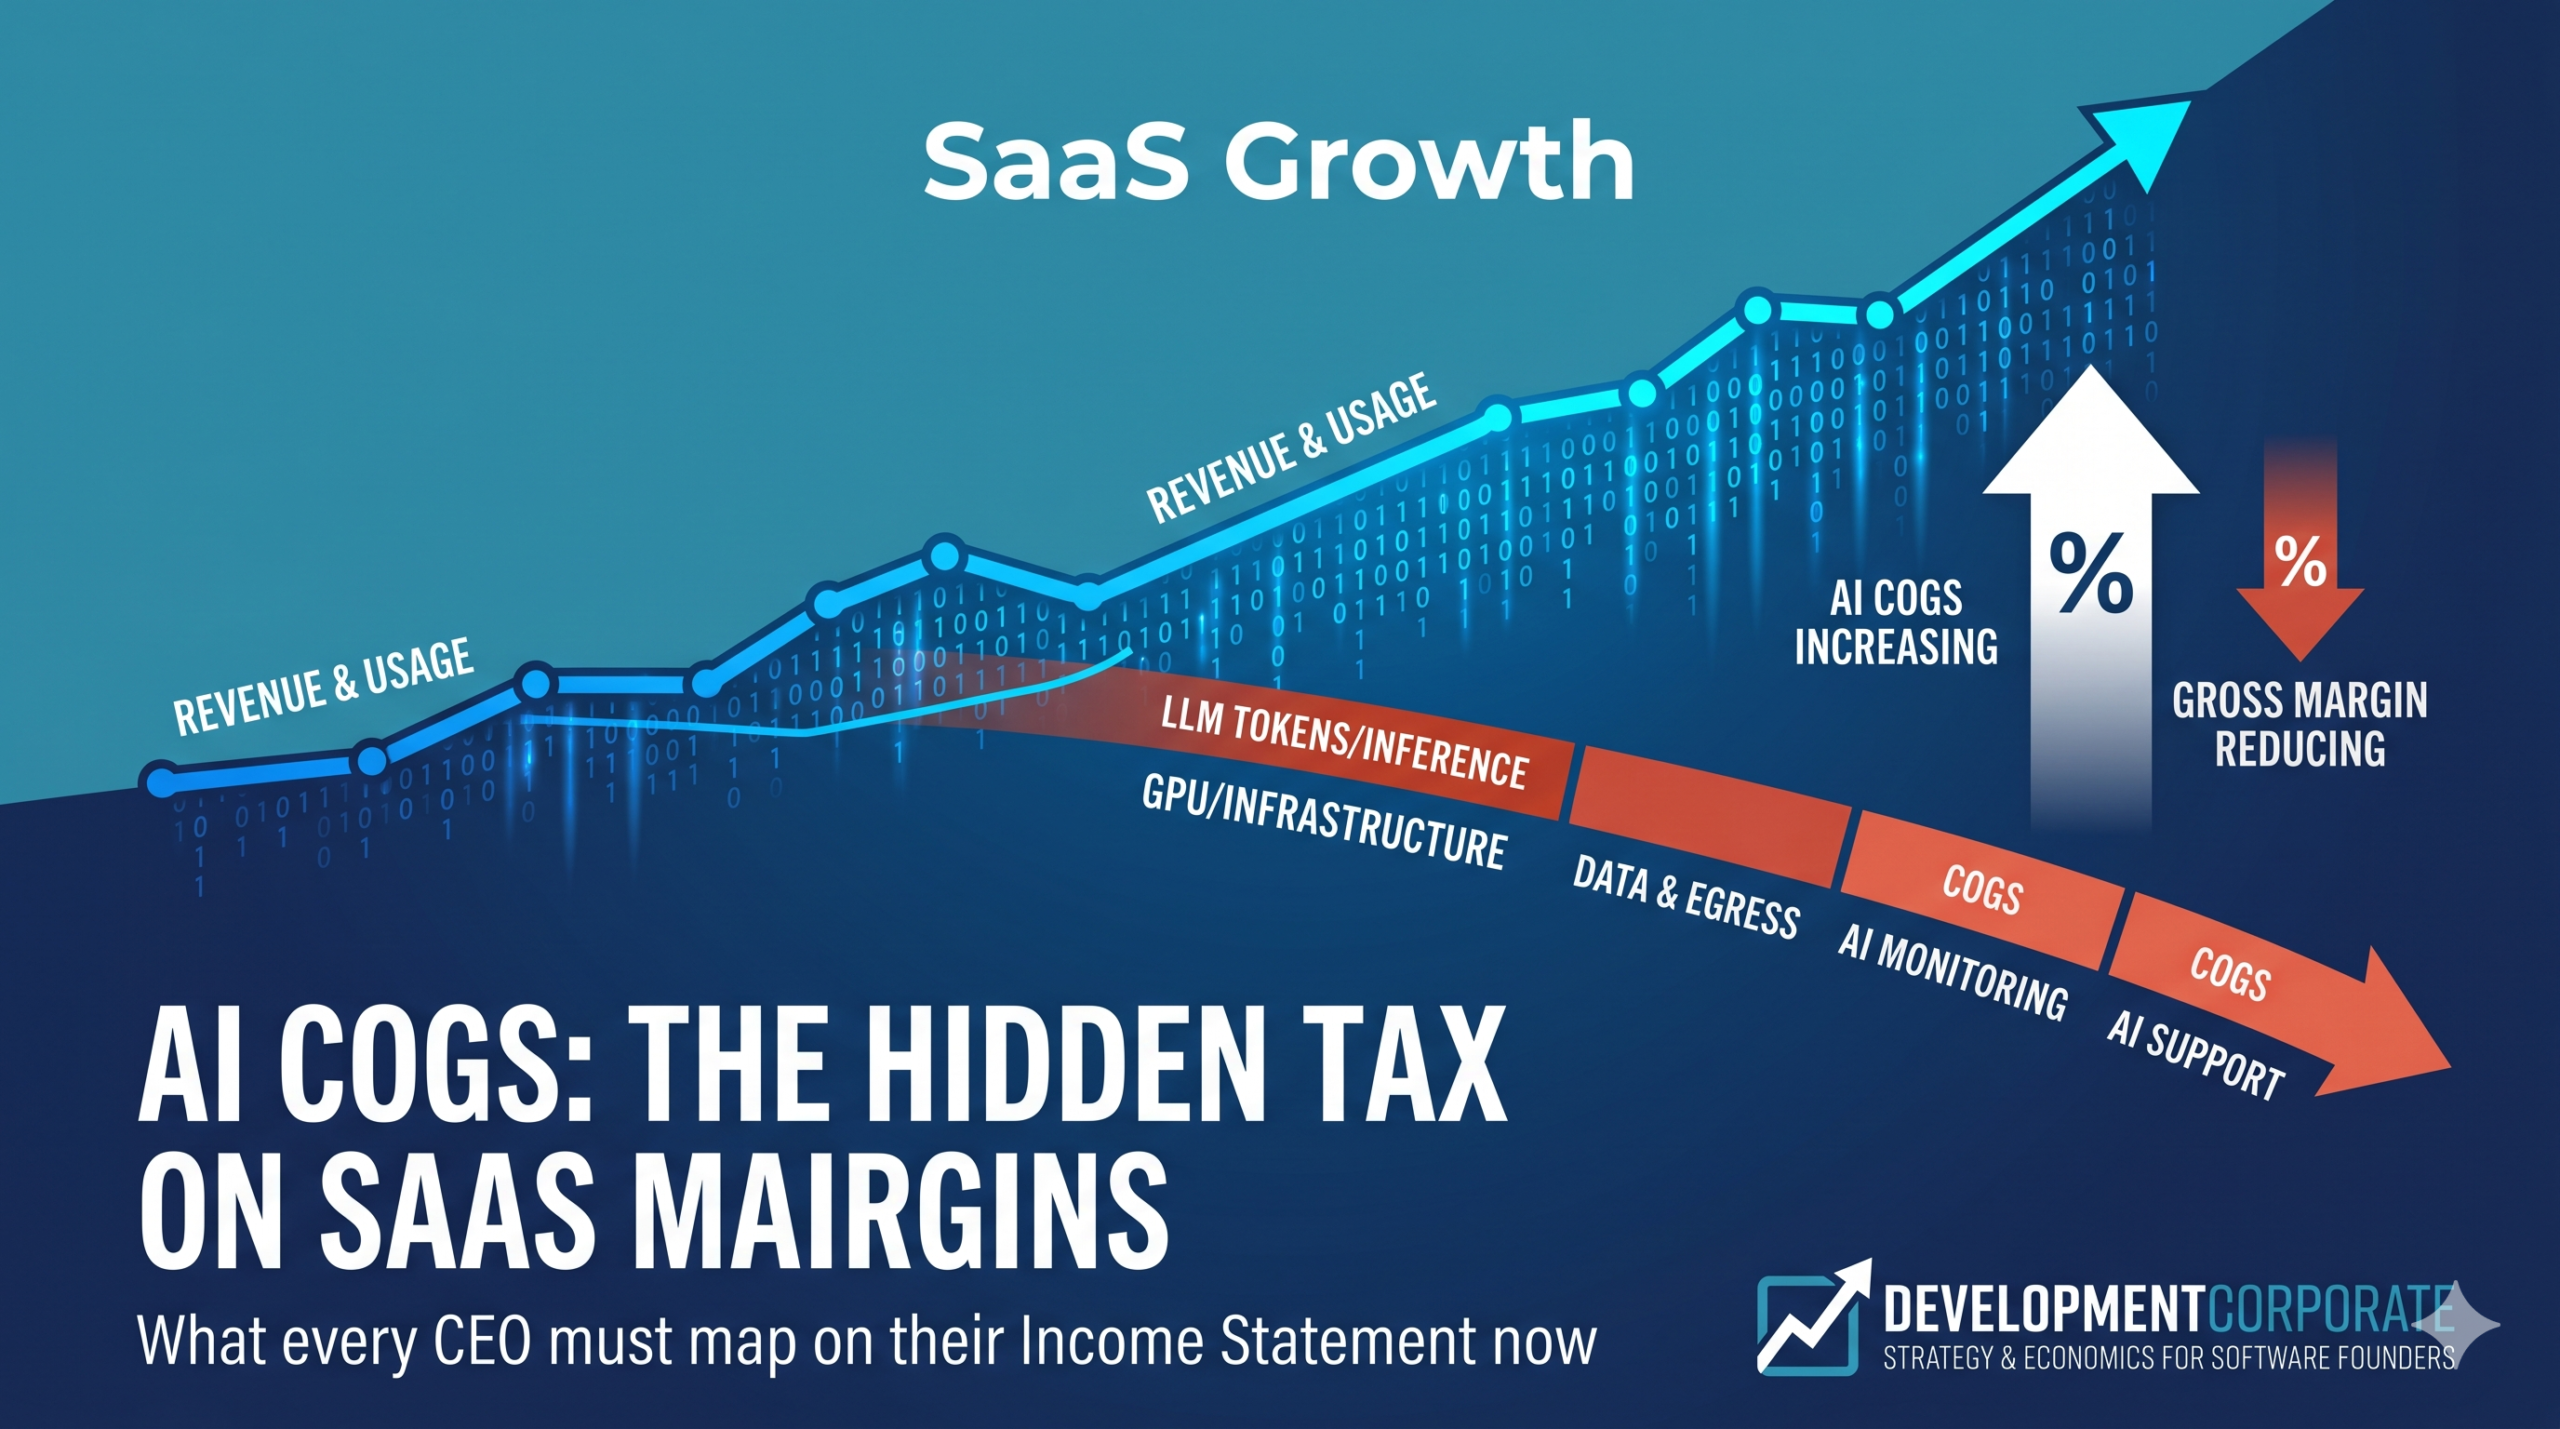
AI COGS is the most important line on your income statement that you have probably never been shown. If you shipped AI features in the last 18 months, your gross margin already looks different than it did before. The dashboard still says revenue is up and to the right. The story you tell investors still works. But underneath the headline, the cost of delivering your product has quietly changed, and most founders cannot yet see it.
That gap, between the growth story on the slide and the margin reality in the ledger, is the subject of this guide. It builds on a sharp CFO-level breakdown by Ben Murray of The SaaS CFO, and reframes it for the person who actually owns the consequences: you, the CEO. Your finance lead classifies the costs. You decide what they mean for pricing, runway, and the next round.
Here is the uncomfortable part. The classic 70 to 80 percent SaaS gross margin is no longer a law of nature. For AI products it is a target you have to earn, and the default outcome, if you do nothing, is erosion you will not notice until it is expensive to fix.
Why AI COGS Is a CEO Problem, Not Just a Finance Problem
It is tempting to file AI COGS under accounting and move on. Resist that. Cost of goods sold is not a bookkeeping detail. It is the number that decides whether each customer you add makes you stronger or weaker. When that number moves, three things you care about move with it.
Your pricing stops making sense. If a feature costs you real compute every time a customer uses it, flat per-seat pricing can turn your best, most active users into your least profitable ones. Heavy users can cost 50 to 100 times more to serve than light users on the same plan. Without AI COGS mapped, you cannot see which customers you are subsidizing.
Your runway shrinks faster than your model predicts. A cost that scales with usage behaves nothing like a fixed SaaS hosting bill. As adoption climbs, spend climbs with it, often faster than revenue. Founders who do not model this watch their burn drift wide of plan and only diagnose the cause months later.
Your fundraise gets harder. Investors have caught on. They now scrutinize the unit economics of AI features, not just the adoption story. As we covered in our breakdown of the SaaS metrics that matter most for $1M to $5M ARR startups, median software gross margin for that cohort has already slipped to 77 percent, with compute and inference costs eating in faster than pricing can offset. A founder who can explain their AI cost-to-serve in a pitch looks like an operator. One who cannot looks like a risk.
AI COGS is not an accounting footnote. It is the number that decides whether your next 1,000 customers make you stronger or weaker.
The good news: this is fixable, and fixing it early is cheap. The cost of mapping AI COGS today is a few weeks of focused finance and engineering work. The cost of discovering the problem later is a repricing scramble in the middle of a raise. This guide gives you the framework, the five cost categories to track, the benchmarks to judge yourself against, and a 90-day plan to get it done.
| FOR THE FOUNDER RAISING A ROUNDTreat AI cost-to-serve as a headline metric, not a backup slide. Be ready to state your inference cost per active user, your gross margin on AI features specifically, and the trend line on both. Investors increasingly ask. A crisp answer signals you run the business on real numbers. |
What AI COGS Actually Means (And Why Your Old Benchmark Lies)
Start with the one rule that has not changed. Costs to deliver your product belong in COGS. Costs to build your product belong in research and development, which sits in operating expenses. A server that answers customer requests is COGS. An engineer prototyping a new model is R&D. Simple enough.
AI breaks the simplicity because the same vendor often lives on both sides of the line. You might pay OpenAI or Anthropic to power a customer-facing feature (COGS) and to run an internal coding assistant for your engineers (operating expense), on the same invoice. If you do not separate these, your margin math is wrong from the first month.
Here is the split that matters, in plain terms:
- Production inference that answers customer requests is COGS.
- Development and test inference, where engineers experiment, is R&D and operating expense.
- GPU compute serving live customers is COGS. GPU compute for training runs is R&D.
- A vector database answering customer queries is COGS. The same database used only for internal experiments is not.
The single most valuable operational step you can take is to separate your production and development AI accounts. If engineers test models in the same account that serves customers, you can never cleanly split the cost, and every later number is unreliable. This is the AI version of the cloud-bill hygiene you already practice. There is also an accounting layer here, covering how training is expensed or capitalized under standards like ASC 730 and ASC 350-40, plus a recent FASB update; that is real, but it is a conversation for your CPA. As a CEO, your job is the strategy, not the journal entries. For the technical classification detail, the original SaaS CFO guide and this primer on AI cost classification are good references to hand your finance lead.
Why your 70 to 80 percent benchmark now lies to you
For two decades, healthy SaaS meant 70 to 80 percent gross margins. That benchmark assumed near-zero marginal cost per user. Software was cheap to copy. Adding one more customer cost almost nothing. AI breaks that assumption, because every AI interaction has a real compute cost attached.
So when you measure an AI-featured product against the old 70 percent floor, you are using a ruler built for a different product. A 70 percent gross margin might be a triumph for an AI-native product and a quiet disaster for a traditional one. The only way to know which is to map your AI COGS first, then recalibrate the benchmark to match what you actually sell. The chart below shows just how far the ground has shifted.

Figure 1: AI gross margin benchmarks vs. the traditional SaaS floor. The old 70% rule does not apply to AI-native or heavily AI-featured products.
The Five Components of AI COGS Every Founder Should Track
You do not replace your existing COGS when you add AI. You layer new line items on top of the support, services, and DevOps costs you already track. There are five of them. Read each one asking a single question: is this cost showing up in my margin, and do I know how big it is?
1. Inference Costs: Your New Hosting Bill
Every time your product calls a model to answer a question, summarize a document, or generate output, you pay. The unit is the token. The more tokens your product consumes, the bigger the bill. This is the largest new line in AI COGS, and the most variable cost most software companies have ever carried.
Two forces make this dangerous to ignore. First, usage intensity varies wildly. Your power users may cost 50 to 100 times more than your casual ones, so a single pricing plan can hide a portfolio of profitable and deeply unprofitable customers. Second, there is a treadmill effect. Per-token prices keep falling, which sounds like relief, but reasoning models and agentic workflows now burn 10 to 100 times more tokens per task than the simple completions of 2023. Net cost per task is rising even as the price per token drops. As SaaStr has detailed in its analysis of AI gross margins, cheaper tokens have not rescued the unit economics for most companies, because the work per task keeps expanding.
What to watch:
- Your inference cost per active user and per request, tracked monthly.
- Whether your heaviest users are still profitable, broken out by cohort.
- Whether you are using the cheapest model that does the job, instead of paying frontier prices for simple tasks.
- Whether you are charging for AI usage or silently absorbing it.
Bottom line: inference is your new hosting bill, except it scales with usage and gets more expensive as your features get smarter.
2. Model Hosting and GPU Infrastructure
If you run models on your own infrastructure instead of calling someone else’s API, you pay for GPU compute directly. GPUs cost far more per hour than the ordinary servers behind a traditional app, supply is tight, and idle capacity burns money fast. Instead of paying per call, you pay for capacity, whether you use it or not.
This is a structural shift, not just a vendor swap. It moves AI cost from a variable per-call line to a fixed-infrastructure line, with very different margin behavior. Some companies are repatriating workloads, meaning they bring AI in-house rather than pay per-call API fees; survey data shows a majority are at least planning some form of it. For an early-stage company, though, this trade is usually premature. Fixed GPU commitments only pay off at scale and with steady, predictable load. Most seed and Series A products do not have either yet.
What to watch:
- Your GPU utilization rate. Cloud waste averages around 35 percent, and AI workloads are especially prone to idle compute, per CloudZero’s cloud cost research.
- Whether you are locked into reserved capacity or paying on-demand.
- Whether you truly need always-on infrastructure or can scale down between usage bursts.
Bottom line: GPU infrastructure trades a variable API bill for a fixed-cost commitment and real operational complexity. Most early-stage companies are not ready for that trade, and that is fine.
3. The AI Infrastructure Layer: The Invisible Stack
Modern AI products rarely call a model directly. Between your app and the model sits a supporting stack: vector databases for retrieval, embedding pipelines, agent orchestration, data platforms, and the bandwidth to move data between all of it. When these serve production customers, they belong in COGS. And they are where the nastiest surprises live.
This is the finding most founders miss entirely. In the 2025 State of AI Cost Governance survey from Mavvrik and Benchmarkit of 372 companies, data platform usage (56 percent) and networking and egress charges (52 percent) topped the list of unexpected AI costs. Both ranked higher than LLM tokens (37 percent). If you are watching only the model bill, you may be staring at the wrong line item entirely.

Figure 2: The biggest AI cost surprises are not the model bill. Data platform usage and egress charges outrank LLM tokens as sources of unexpected spend.
Egress charges deserve special mention because they are nearly invisible until they are not. These are the fees cloud providers charge when data leaves their network, and a retrieval-heavy AI product can move a lot of data between regions and out to model providers. Vector databases are the other quiet drain: oversize one for your current usage and you pay for capacity you do not need.
What to watch:
- How much of your Datadog or Snowflake bill is actually driven by AI workloads.
- Egress charges between cloud regions and out to model providers.
- Whether your vector database is sized correctly for current usage.
Bottom line: the middleware, data, and egress stack is the invisible cost behind your model bill. Find it before it finds you.
4. AI Monitoring and Observability
AI observability tells you whether your AI is producing useful, accurate, and safe output. Without it, hallucinations, wrong answers, and silent failures surface only when a customer complains, which is the most expensive possible moment to learn. Tools in this category trace model calls, track token costs, evaluate output quality, and catch guardrail violations. Because they are production infrastructure for an AI product, they belong in COGS.
For a CEO, the case for this spend is risk, not just hygiene. A confident, wrong answer from your product damages trust faster than an outage, because users may not realize anything broke. Catching quality problems before customers do is now part of the cost of selling an AI product, the same way a status page is part of selling SaaS.
What to watch:
- Whether you find AI quality issues before your customers do.
- What you spend on AI monitoring, and whether it is correctly tagged as AI COGS.
- For regulated customers, whether you can show a history of AI output for compliance.
Bottom line: AI observability is no longer optional, and it lives in COGS.
5. AI-Related Support Costs
New features create new failure modes, and AI features create unfamiliar ones. Your support team now fields tickets that did not exist a year ago: “The AI gave me wrong information,” or “I don’t understand why it did that.” That incremental support load is a real cost of delivering your AI product, and a share of it belongs in your AI COGS picture.
This one is easy to undercount because it hides inside a team you already have. The fix is not a new budget line so much as new visibility. Tag AI-related tickets, measure their volume, and compare their handle time to standard tickets. AI tickets are often slower to resolve because they require investigating what the model actually did. If you never tag them, that cost stays buried in a blended support number and your AI margin looks better than it is.
What to watch:
- Whether your support tickets are tagged for AI at all.
- The share of inbound volume that is AI-related.
- Average handle time for AI tickets versus standard ones.
Bottom line: AI tickets are not regular tickets. Tag them separately or you will misread your true cost-to-serve.
| FOR THE ENTERPRISE CTO OR CPO EVALUATING AI FEATURESArchitecture is a margin decision, not just a technical one. Model routing, caching, retrieval design, and observability tooling each show up directly in cost-to-serve. The product and engineering choices made early decide whether the AI feature is a margin asset or a margin liability at scale. Build cost attribution in from the first release, not as a later retrofit. |
The AI Gross Margin Reality Check
Once your AI COGS is mapped, you can finally answer the question that actually matters: is this margin good or bad for what we sell? The honest answer depends on which kind of company you are.
AI-native SaaS, where inference is core to value and every interaction carries compute cost, tends to mature at 50 to 65 percent gross margin. Early-stage AI-native companies frequently run at 25 to 30 percent, and Bessemer’s 2025 dataset shows fast-ramping companies it calls “Supernovas” operating at negative gross margins on their way up. We unpacked the implications of those numbers in our analysis of AI startup economics.
AI-enabled SaaS, meaning traditional software with AI features bolted on, holds up better, landing around 72 to 85 percent depending on how AI-intensive the product is and whether you charge for AI usage. Most early-stage founders building today are in this second camp, which is the more defensible place to be.
The trend line is improving but still sobering. ICONIQ’s 2026 data projects average AI product gross margins at 52 percent, up from 41 percent in 2024. That is real progress. It is also well below what traditional SaaS investors were trained to expect. And the pressure is broad: in the cost governance survey, 84 percent of companies reported AI delivery costs cutting product gross margins by more than 6 points, with over a quarter seeing hits of 16 points or more.
A 70 percent gross margin can be excellent for an AI-enabled product, but only if you mapped your AI costs in the first place. Otherwise it is a guess wearing a benchmark.
The takeaway is not despair. It is recalibration. Pick the benchmark that matches your product, measure honestly against it, and treat any number you cannot explain as a problem to solve rather than a figure to defend.
A Worked Example: How One AI Feature Reshapes Your Margin
Abstractions are easy to nod along to and hard to act on, so let us make this concrete with a simple, illustrative model. The numbers below are rounded for clarity, not pulled from any single company, but the shape of the math is exactly what founders run into.
Imagine a seed-stage SaaS company at $1.2M ARR. Before AI, it ran a clean 80 percent gross margin. Hosting, support, and DevOps cost roughly $20 of every $100 in revenue, and the rest dropped to gross profit. Healthy, familiar, fundable.
Now the team ships an AI assistant. It is a hit. Customers love it, usage climbs, and the next board deck shows a great adoption curve. But three new costs have quietly entered the picture. Inference now runs about $9 per $100 of revenue. The infrastructure layer, the vector database, embeddings, and the egress nobody budgeted for, adds another $6. AI-specific support and observability add $3 more. That is $18 of new cost per $100 of revenue, layered on top of the original $20.
Gross margin has fallen from 80 percent to 62 percent. Nothing on the growth dashboard flagged it. Revenue rose, usage rose, customers were happy, and the single most important efficiency number in the business dropped 18 points. If the feature was given away inside the existing subscription, every new power user makes the problem worse, not better.
Watch what the two levers do from here. Suppose the company introduces a usage-based add-on that recovers half of the inference cost from the heaviest users, and tightens model routing so that simple requests stop hitting the frontier model, cutting inference cost by a third. Inference drops from $9 to roughly $6, and a few dollars of that is now passed through in pricing. Gross margin recovers toward the low 70s. Same product, same customers, a dramatically different business, decided entirely by choices the CEO controls.
Revenue rose, usage rose, customers were happy, and the single most important efficiency number in the business dropped 18 points. That is what unmapped AI COGS looks like.
The lesson is not the precise figures, which will vary by product. It is the pattern. AI cost arrives quietly, lands hardest on your most engaged users, and stays invisible until you go looking for it. The only way to see it in time is to have mapped AI COGS before the feature scaled, not after the margin surprise.
Three Costly Mistakes Founders Make With AI COGS
Across the companies wrestling with this, the same avoidable errors keep surfacing. None of them require deep finance expertise to fix. They require knowing to look.
Mistake one: watching only the model bill
The OpenAI or Anthropic invoice is the obvious number, so it is the one founders track. But as the cost governance data showed, data platform usage and egress charges outrank model tokens as sources of unexpected spend. Fixating on the model bill means missing the larger surprise sitting one layer down in the stack.
Mistake two: blending AI cost into one cloud line
When AI inference, GPU time, and infrastructure all flow into a single “cloud” or “infrastructure” bucket, you lose the ability to ask the questions that matter. You cannot see cost per user, you cannot separate production from experimentation, and you cannot tell whether a pricing change worked. Granularity is the whole point. Without it, you have a number, not an instrument.
Mistake three: pricing AI as if it were free to deliver
The most expensive mistake is folding a compute-hungry feature into a flat subscription because it feels generous or simple. It is generous, to your margin’s detriment, and it gets worse precisely as the feature succeeds. Adoption that should strengthen the business instead drains it. Decide deliberately whether to charge for AI usage; do not back into absorbing it by default.
The Two Levers That Decide Where Your Margin Lands
Two companies with identical AI features can post wildly different margins. The difference comes down to two levers, and both sit squarely on the CEO’s desk.
Lever one: pricing discipline
Companies that package and charge for AI usage post materially better margins than those that fold AI into the base subscription and hope. Give a compute-hungry feature away for free and you are subsidizing your customers’ usage out of your own runway. Even category leaders have learned this: the broader market has shifted toward platform-plus-usage models precisely because flat pricing cannot absorb variable compute costs forever.
For early-stage founders this is the highest-leverage move available, because pricing changes flow straight to margin without requiring you to touch the product. If you are unsure what the market will bear, test it before you guess. Our walkthrough of Van Westendorp and Gabor-Granger pricing tests shows how to find willingness-to-pay with real data, and our overview of SaaS pricing strategy covers how usage-based and hybrid models actually behave. The pattern we keep seeing, and that the 2026 go-to-market data reinforces, is that hybrid pricing correlates with the healthiest retention and margin outcomes.
Lever two: model routing efficiency
The second lever is technical but the CEO should understand it, because it is pure margin. Route most tasks to smaller, cheaper models, and escalate only genuinely hard cases to expensive frontier models. Burning frontier tokens on simple work is one of the most common and avoidable cost habits in AI products. Add caching where the same questions recur, and the savings compound.
Together these two levers explain most of the gap between a 30 percent AI margin and a 70 percent one. Neither requires new funding. Both require attention. The chart below shows the stakes: most companies are not avoiding margin erosion, they are managing how severe it gets.

Figure 3: Margin erosion is nearly universal among AI adopters. The question is not whether AI takes margin, but how many points, and whether you are steering the outcome.
Notice what this distribution implies. Avoiding margin impact entirely is rare. The real contest is between the 58 percent taking a moderate, manageable hit and the 26 percent taking a severe one. The two levers above are largely what separates those groups. As we argued in our look at how AI is rewriting the economics of software work, the founders who treat cost discipline as strategy, not cleanup, are the ones who keep the savings.
How to Map AI COGS: A Founder’s 90-Day Plan
Do not try to do everything at once. Work in three waves, in order. Each wave makes the next one possible, and the first wave is the one that everything else depends on.
Days 1 to 30: get the plumbing right
- Separate your production and development AI accounts. Until this is done, every later number is unreliable, so start here.
- Separate internal AI use from AI inside your product. Your engineers’ coding assistant is not COGS; your customer-facing feature is.
- Create new ledger accounts, or a dedicated AI cost center, for the five categories above: inference, model hosting, the infrastructure layer, observability, and AI support.
- Start tagging support tickets for AI, and begin measuring AI ticket volume and handle time.
Days 31 to 60: turn data into decisions
- Calculate AI cost per user and per workflow, broken out by cohort. Compare your average users against your power users, and find out whether your heaviest users are still profitable.
- Audit your pricing. If you are absorbing AI cost today, model what consumption-based or hybrid pricing would do to your margin before you commit to either.
- Tighten model routing. Ask your team how much frontier-model traffic could be served by a cheaper model, and add caching where the same requests repeat.
Days 61 to 90: set the new normal
- Recalibrate your gross margin benchmark to AI-native or AI-enabled, whichever you actually are, and brief your board on the new target so nobody is surprised.
- Document your cost classification method so it survives the next audit and the next finance hire. Hand the accounting positions to your CPA to make explicit.
- Decide whether any infrastructure trade-offs, like committing to dedicated GPU capacity, make sense at your current scale. For most early-stage companies the answer is not yet, and writing down why is itself useful.
Sequenced this way, the work is manageable. The mistake is skipping wave one. Without separated accounts and tagged costs, the cohort analysis in wave two is built on sand, and the pricing decisions that follow inherit the error.
| FOR THE INVESTOR READING A FOUNDER’S DECKAsk one question: can the team state AI cost-to-serve by cohort? A founder who can show inference cost per active user, gross margin on AI features, and the trend on both is running the business on instruments. A founder who waves at a blended margin number is flying blind, and the margin surprise is usually waiting in the data platform and egress lines, not the model bill. |
What Good Looks Like: The AI Finance Maturity Curve
It helps to know where you sit, because the goal is not perfection on day one. It is steady movement up a curve. Most companies pass through four stages.
Stage one is blind. AI costs land in a blended cloud or vendor bill with no separation. Margin is a mystery and surprises arrive by invoice. Most companies that added AI in the last 18 months are still here, whether they admit it or not.
Stage two is mapped. Production and development are separated, the five cost categories have their own accounts, and you can state your AI gross margin with a straight face. This alone puts you ahead of the majority.
Stage three is managed. You track cost per user and per cohort, you know which customers are profitable, and your pricing reflects what AI actually costs to deliver. Model routing and caching are live. Margin is now a lever you pull, not a number you receive.
Stage four is strategic. AI cost-to-serve informs which features you build, how you price them, and which customer segments you pursue. Finance and engineering speak the same language about margin. At this stage your cost structure becomes a competitive advantage, because you can profitably serve usage patterns that sink less disciplined rivals.
You do not need to reach stage four this quarter. You do need to leave stage one, because blindness is the only truly dangerous place to be. Everything above stage one is a manageable, improving position. Stage one is the one that ends in a repricing emergency you did not see coming.
If you are weighing a larger strategic shift on top of all this, an enterprise move, a new pricing model, or a pivot, it is worth pressure-testing the economics before you commit. Our framework for running a strategic AI pre-mortem is built for exactly that kind of pre-Series-B decision point, where runway and the next funding story are both on the line.
The Bottom Line for Founders
AI COGS is not a finance chore you can delegate and forget. It is the clearest signal you have about whether your AI investment is economically sound. Map it, and you can price with confidence, forecast your runway honestly, and walk into a fundraise with numbers that make you look like an operator. Skip it, and you are running blind into one of the most expensive product decisions you will ever make.
The market has moved faster than most companies’ finance frameworks. Inference, GPUs, vector databases, and observability are now genuine costs of delivering software, and the old 70 percent margin instinct no longer fits the products founders are shipping. The companies that catch up first will spend less time defending mysterious margins and more time compounding good ones.
Start this week. Separate your production and development AI accounts, create the five cost categories, and tag your support tickets. That is wave one, it takes days not months, and it is the difference between seeing your business clearly and guessing at it.
Your AI COGS structure tells you whether your AI investment is economically sound. Without it, you are guessing about the most expensive decision in your product.
Work with DevelopmentCorporate
DevelopmentCorporate LLC helps enterprise software founders and investors translate market narratives into the numbers that actually drive the business, from unit economics and pricing to margin strategy. If AI cost-to-serve is a question mark on your dashboard, we can help you map it before it shows up in your runway. Read more analysis at DevelopmentCorporate.com.
Sources and Further Reading
- Ben Murray, The SaaS CFO — What Should Be Included in AI COGS — https://www.thesaascfo.com/what-should-be-included-in-ai-cogs/
- ICONIQ — State of AI 2026 (via SaaStr) — https://www.saastr.com/the-execution-era-of-ai-5-key-takeaways-from-iconiqs-state-of-ai-report/
- SaaStr — Have AI Gross Margins Really Turned the Corner? — https://www.saastr.com/have-ai-gross-margins-really-turned-the-corner-the-real-math-behind-openais-70-compute-margin-and-why-b2b-startups-are-still-running-on-a-treadmill/
- Mavvrik + Benchmarkit — 2025 State of AI Cost Governance (N=372) — https://www.mavvrik.ai/state-of-ai-cost-governance-report/
- CloudZero — Cloud Computing Statistics — https://www.cloudzero.com/blog/cloud-computing-statistics/
- AI SpendOps — AI Costs, GAAP Classification, and Financial Controls — https://www.aispendops.com/blog/ai-costs-and-financial-classification