SaaS Logo, Gross & Net Dollar Retention Basics and 2021 Benchmarks
Recurring revenue is a core metric for SaaS companies. It drives valuation, funding, and success. Revenue retention is a major concern for product managers. They need to understand what is going on with the revenue streams from their existing customers. Logo retention, Gross Retention, and Net Dollar Retention are three critical metrics. We’ll review the basics of these metrics and provide 2021 industry benchmarks, segregated by company revenue size.
In this article we will cover:
- SaaS Revenue on the P&L
- ASC 606
- Factors That Drive SaaS Revenue Trends
- Logo Retention
- Gross Retention
- Net Dollar Retention
- 2021 Private Company Median SaaS Gross & Net Dollar Retention 2021 Benchmarks
- 2021 Public Company Median SaaS Gross & Net Dollar Retention 2021 Benchmarks
SaaS Revenues Are Complex & Dynamic
The complexities of monthly billings, revenue recognition, deferred revenue, complex pricing plans, and seasonal business variations make what appears to be simple, complex. Before jumping into the details of SaaS gross and net dollar retention, product managers should make sure they have a solid understanding of SaaS revenue basics.
SaaS Revenue on the P&L
Revenue is the first thing reported on a P&L (aka Income Statement). Here is Oracle Corporation’s Income Statement from the last fiscal year as an example.

Revenues are the first component. Revenues are the sales that are recognized in a specific period. Oracle reports four types of revenue: cloud services and license support, cloud license and on-premise licenses, hardware, and services. Cloud services and license support are subscription revenues that are paid monthly or annually. Cloud licenses and on-premise licenses are perpetual licenses that are paid upfront. This was the normal business practice pre-SaaS. Hardware is the Sun Microsystems product line. Services are the professional services and training that Oracle offers its customers.
Product managers should understand the concept of revenue recognition and how it impacts their products. Revenue recognition is when a company can include specific sales transactions in its Income Statements. Consider a SaaS company whose fiscal year ends on December 31st. They sell an annual SaaS subscription to a customer in June for $120,000. The customer prepays the entire amount in July. The company is only allowed to recognize $60,000 in the current fiscal year ($10,000/month). The remaining $60,000 will be recognized in the next fiscal year. As a result, the product manager’s product line will only get credit for the revenue recognized in the current fiscal year. This could impact their bonus among other things.
Revenue recognition is governed by the standards set by the Financial Accounting Standards Board (FASB) and International Accounting Standards Board (IASB). The specific policy is known as ASC 606 Contracts with Customers. ASC 606 not only deals with revenue recognition but expense recognition. This impacts a company’s profitability. ASC 606 was initially launched in 2016 and all companies had to comply by 2020.
In the Oracle Income Statement, the cloud services and license support revenue line is an example of subscription revenues impacted by ASC 606. License support is what used to be called software maintenance revenue. These are services like customer support and software upgrades for on-premise licensed software like Oracle DBMS. Cloud license and on-premise license revenue cover perpetual licenses sold to customers. This was the industry standard pre-SaaS. These revenues are usually recognized all at once. Hardware revenues are similar. Services revenues are recognized as they are delivered.
To brush up on your P&L basics check out Why Should Product Managers Care About Income Statements? and Product Managers Should Understand SaaS Revenue Basics
ASC 606
ASC 606 Contracts with Customers. Is the revenue recognition standard that affects all businesses that enter into contracts with customers to transfer goods or services – public, private and non-profit entities. Both public and privately held companies should be ASC 606 compliant now. In the past, revenue recognition standards differed between the generally accepted accounting principles (GAAP) in the United States and the global provisions set by the International Financial Reporting Standards (IFRS). It was universally acknowledged that these rules needed to evolve due to the varying ways they were being applied and loopholes they created, so the Financial Accounting Standards Board (FASB) and International Accounting Standards Board (IASB) launched a joint initiative to better align these standard practices globally, which resulted in the 2014 publication of the new “Topic ASC 606: Revenue from Contracts with Customers”. ASC606 started being implemented in 2016, by 2020 al companies had to comply
Basic revenue recognition is similar, but now there are more complicated requirements for handling items like Post Contract Support (PCS), setup/customization fees, variable considerations like Service Level Agreement bonuses, and penalties. Check out this excellent primer from PWC on the differences between GAAP reporting and ASC 606 reporting.
On the expense side, the incremental costs of obtaining a contract (commissions, etc.) are handled differently than under GAAP/IFRS. Commission expenses can continue to be recognized when incurred if the determined amortization period is one year or less. Commission expenses must be amortized for individual reps over the anticipated life of the customer if the contract is longer than one year, but any indirect or rolled commissions for supervisors/managers will continue to be recognized immediately regardless of the determined contract term length. Every time the existing rep or other rep sells to the customer again, you must evaluate if that extends the life of the customer or servicing existing life expectancy. For each additional commission calculated and paid, you must be able to quantify the impact their action did to further that customer for commission expense amortization considerations.
The practical implementation of ASC 606 results in higher profitability for most products due to the longer-term amortization of incremental costs of obtaining a contract. Revenue is generally not affected since under GAAP and IFRS revenue recognition was tied to when the service was delivered. In the case of prepays, like a prepaid annual subscription, the cash payment was recorded as deferred revenue and then recognized month by month.
ASC 606 is a complicated topic that I usually beyond the scope of most product managers’ training. They should work closely with their finance team to understand how ASC 606 has impacted the P&L of their products. Check out Why Product Managers Should Become Best Friends with Finance Team
Many Factors That Drive SaaS Revenue Trends
Product managers should understand the trends associated with SaaS product revenue performance. The pricing of a SaaS product can be complex. A typical SaaS product price can include:
- Packages/Editions. Most SaaS products offer different packages/editions (starter, professional, enterprise, unlimited). Each package contains specific features and functions. Each package has its own price.
- Per-User/Seat Charge. The monthly cost for a user to access the system. User/Seat Pricing is often sold in packages (100 authorized users, 500 authorized users, etc.). The larger the package, the better per user/seat pricing can be. Some products charge only for active users in a billing period, others charge for all the users in a package.
- Modules. Many SaaS products offer a core product as well as a number of add-on products for an additional charge. Saleforce.com, for example, offers 15 different add-on modules for each of their four editions (essential, professional, enterprise, and unlimited).
- Transactions/Usage. Some SaaS products charge for each transaction that they process. Often transactions are sold in packages (25,000 transactions/month). If the monthly transaction count is exceeded, overage charges apply. Transaction counts can vary dramatically during the year due to seasonal effects. In retail, the Christmas holiday often represents a huge spike in transactions in comparison o the rest of the year.
- Miscellaneous Fees. Amazon Web Services, for example, has no charge for data loaded into its Simple Cloud Storage (S3), but charges egress fees when data is retrieved from the cloud.
The combination of one or more of these factors can make it hard for product managers to see through the complexity to understand how their SaaS products are growing or shrinking.
SaaS Logo, Gross & Net Dollar Retention Basics
Product revenue retention is a critical concept that product managers need to understand. As pointed out by Amy Gallo in the Harvard Business Review “acquiring a new customer is anywhere from five to 25 times more expensive than retaining an existing one. As pointed out by Frederick Reichheld of Bain & Company (the inventor of the net promoter score) increasing customer retention rates by 5% increases profits by 25% to 95%.
There are many ways to measure retention. Three of the most popular include Logo, Gross & Net Dollar Retention.
Logo Retention
Logo retention is an analysis of how many customers remain with your company over a period of time. Another way of looking at it is how many existing customers cancel over a specific time period. One formula is:
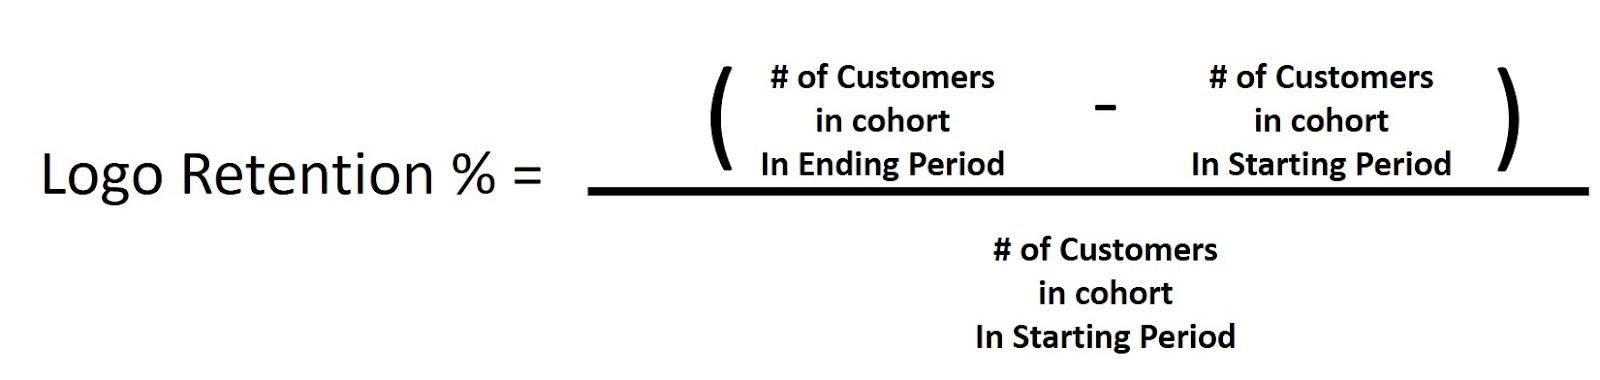
An example would be:
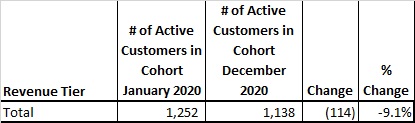
A total Logo Retention stat makes a good headline, but product managers need to ‘peel the onion’ a bit to really understand logo retention. Product managers should segment customer retention data further. For example, one segmentation could be by the relative size of customer revenues, or revenue tiers:
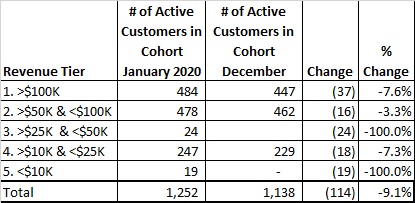
In this example, Tiers 3 and 5 showed almost total attrition. This company had introduced some new pricing plans that simply did not work. You could not tell that from the summary numbers, you needed to rill into the details to see it. There are many ways product managers can segment the data – by customer revenues, industry, sales territory, or even by sales rep. For more details about how product managers can leverage segmented data, check out Why Pareto Analysis is Important for Product Managers.
Gross Retention
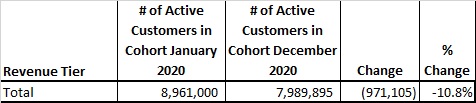
Gross Retention is an analysis of how much revenue is retained from a cohort of customers over time. This focuses on revenue from already purchased products. It intentionally excludes expansion, add-on, or upsold product revenues. It also does not include revenues from new customers that start in the time period covered by the analysis. Gross retention is the financial corollary to Logo Retention.
The Gross Retention formula is:

An example would be:
Like with Gross Retention, further segmentation can reveal details that can be insightful for product managers:

The amount of Gross Dollar Retention losses in a year creates a ‘hole’ that must be filled first before the product can show any revenue growth in the next time period.
Net Dollar Retention
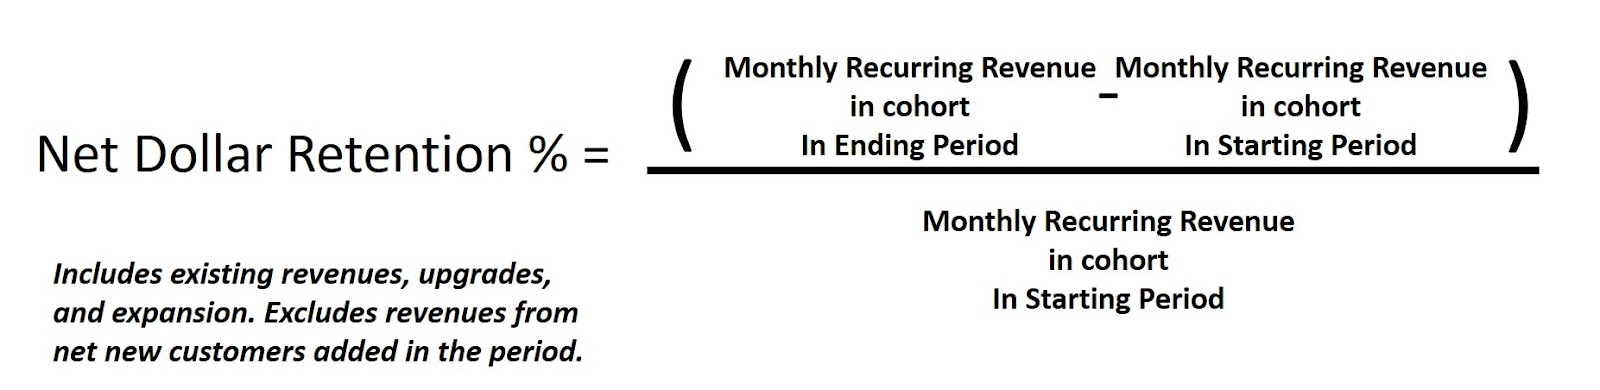
Net Dollar Retention (NDR) is a very popular metric with SaaS companies. NDR is the net amount of growth or declines a cohort experiences in a given time period. It includes existing revenues, upgrades, downgrades, expansion, or add-on revenues the cohort experiences. NDR does not include revenues from net new customers added in the time period under analysis. It shows how a company can grow its relationship with its existing customers.
The formula for Net Dollar Retention is:
An example would be:
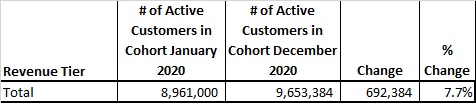

In this example, new revenues, especially from the top two revenue tiers, overcome the losses from attrition and show overall revenue growth.
SaaS Retention Metrics Require New Tools
Producing SaaS Logo, Gross & Net Dollar Retention metrics is not easy. While the full adoption of ASC 606 started in 2016 and was required for all companies in 2020, many firms have not implemented the systems required to accurately report ASC 606 compliant metrics. It is had, but not impossible, for product managers to calculate these types of metrics using Excel. A class of new SaaS subscription billing and management applications he arisen. Check out market leaders Recurly, SaaSOptics, and Profitwell.
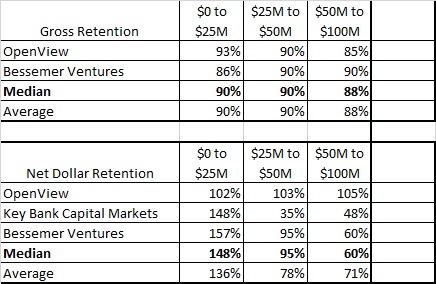
2021 Gross and Net Dollar Retention Benchmarks
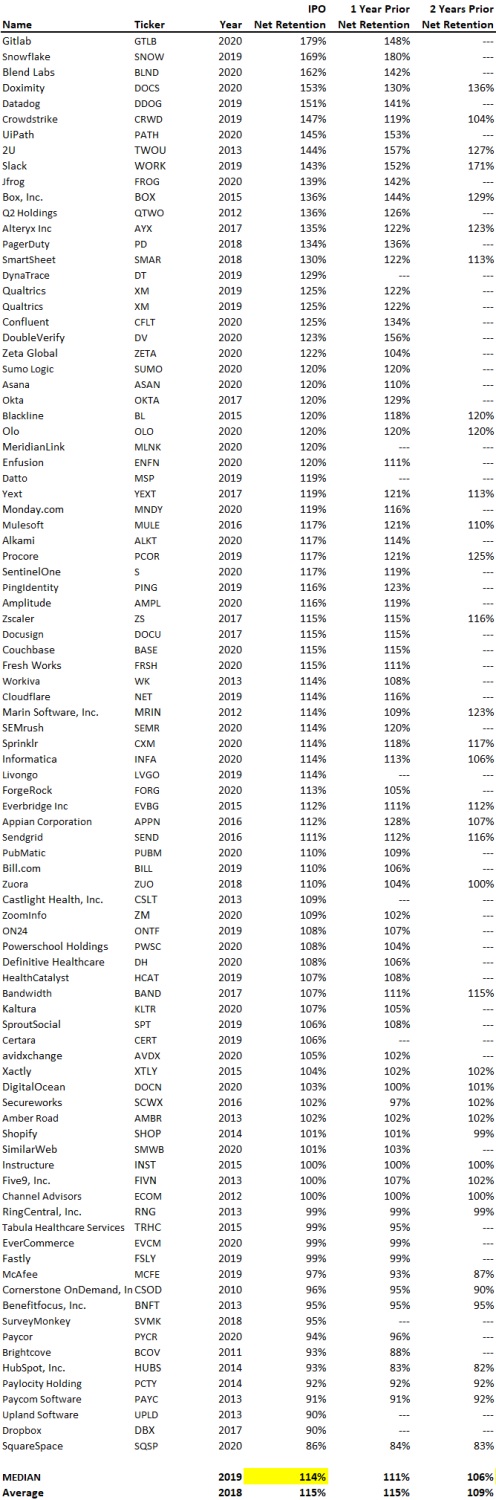
For private companies in 2021, the median Gross Retention was between 88% and 90%. The median Net Dollar Retention was between 60% and 148%. For public SaaS companies the median Net Dollar Retention rate was 114%.
Some industry benchmark reports that have been very insightful include:
- Key Bank Capital Markets 2021 SaaS Metrics report
- Bessemer Ventures Scaling to $100 Million
- Openview Partners SaaS Financial & Operating Benchmarks 2021
One of the great things about these reports is they break out retention benchmarks by the size of a company’s annual revenues. These reports focus on private SaaS companies versus public companies. This is important since there is a high degree of variability between companies of different sizes. The following chart, from the Key Bank study, shows the variability of revenue growth rates by companies of different sizes:
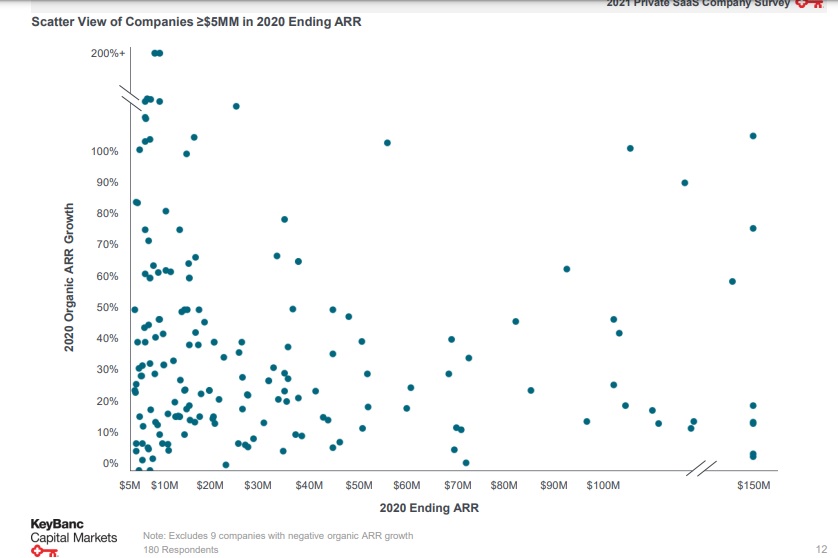
Key Bank Capital Markets 2021 SaaS Metrics report
Given this variability, it is better to rely on median rates versus averages.
2021 Private Company Median SaaS Gross & Net Dollar Retention Benchmarks
The following table shows median 2021 SaaS Gross & Net Dollar Retention Benchmarks by revenue scale:
2021 Public Company Median SaaS Gross & Net Dollar Retention Benchmarks
Sammy Abdullah of Blossom Street Ventures prepared a summary of public SaaS companies Net Dollar Retention rates from 91 public companies:
Summary
Recurring revenue is a core metric for SaaS companies. It drives valuation, funding, and success. Revenue retention if a major concern for product managers. They need to understand what is going on with the revenue streams from their existing customers. Logo retention, Gross Retention, and Net Dollar Retention are three critical metrics. For private companies in 2021, the median Gross Retention was between 88% and 90%. The median Net Dollar Retention was between 60% and 148%. For public SaaS companies the median Net Dollar Retention rate was 114%.