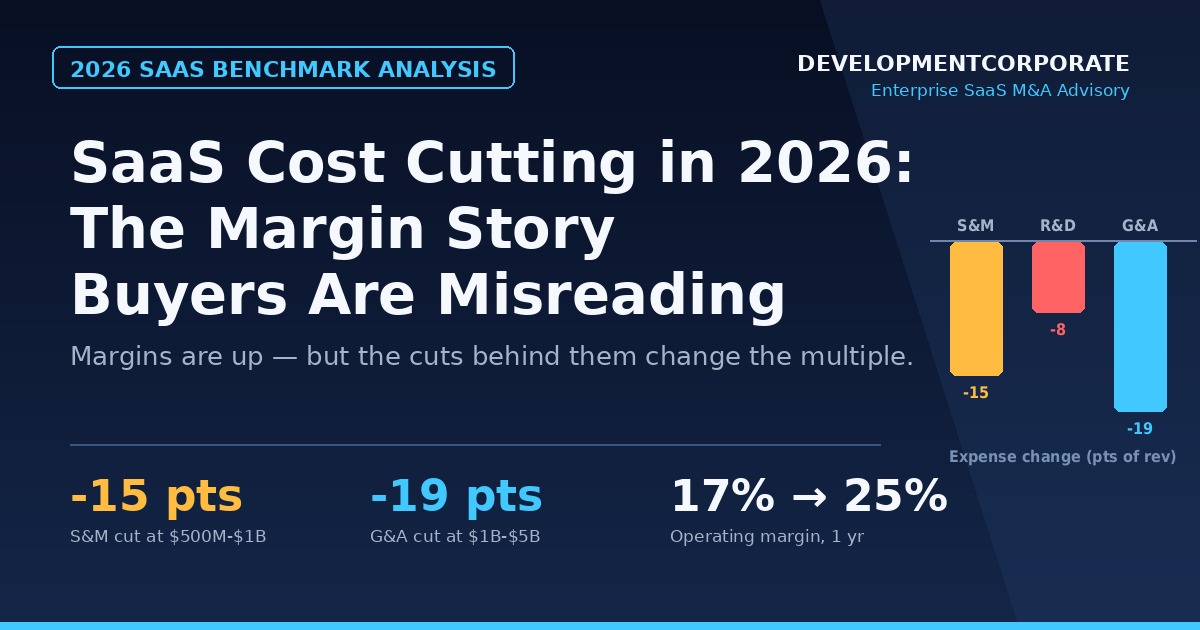
SaaS Cost Cutting in 2026: The Margin Story Buyers Are Misreading
SaaS cost cutting is back in the headlines, and the 2026 benchmark data appears to vindicate it. OPEXEngine’s latest release, drawn from its proprietary database of 250+ operational and financial metrics combined with the BVP Nasdaq Emerging Cloud Index, shows operating margins expanding across nearly every large revenue cohort. The $500M–$1B segment improved from 17% to 25% in a single year. The $100M–$500M cohort moved from 7% to 11%. On the surface, this is the efficiency-era success story the industry has been promising investors since 2022.
But the second post in OPEXEngine’s series — “SaaS Companies Are Still Trimming Costs, but Not the Same Ones” — answers a question most coverage skips: where, precisely, is the margin coming from? The answer should make every acquirer, lender, and limited partner uncomfortable. The margin expansion is real, but its composition is not what the prevailing narrative implies. It is not broad-based operating leverage. It is not AI-driven engineering efficiency. It is, overwhelmingly, a structural amputation of go-to-market spend at scale, plus a long-delayed G&A harvest at the very top of the market.
That distinction matters enormously for valuation. As we documented in our analysis of the valuation trap hiding inside the 2026 SaaS benchmarks, headline profitability improvements and durable enterprise value are not the same thing. A margin point produced by cutting sales capacity is priced differently — or should be — than a margin point produced by genuine unit-economics improvement. This article decomposes the OPEXEngine expense data through an M&A due diligence lens and explains why the source of a margin matters more than its size.
At a Glance: What the 2026 SaaS Cost Cutting Data Shows
- Sales & Marketing is the most consistent cost target across every cohort; the $500M–$1B cohort cut S&M by 15 percentage points of revenue in 2025 alone.
- R&D reductions are scattered — from -8 points ($100M–$500M) to flat ($50M–$100M and $500M–$1B) — and show no uniform AI-efficiency signature.
- Among $1B–$5B public cloud companies, G&A — not S&M — was the dominant lever, falling 19 percentage points of revenue.
- Operating margin gains concentrated in larger cohorts; the $10M–$50M cohort actually deteriorated, from -5% to -6%.
- For acquirers, the implication is direct: 2025-vintage EBITDA must be decomposed by expense line before a multiple is applied. Cut-driven margin and structural margin deserve different prices.
The Margin Expansion Is Real — and Highly Concentrated
Start with the headline result. Operating margin in the OPEXEngine database tracks the EBITDA pattern established in the first post of the series: larger companies are expanding margins while smaller companies stagnate. The $100M–$500M cohort improved operating margin from 7% to 11%. The $500M–$1B cohort jumped from 17% to 25% — an eight-point gain in twelve months. In the BVP Nasdaq Emerging Cloud Index, the $1B–$5B cohort moved from -2% to breakeven, and companies above $5B improved from 12% to 15%.
Smaller companies tell the opposite story. The $10M–$50M cohort slipped from -5% to -6%. The $50M–$100M cohort crawled from -1% to 0%. Two years into the supposed efficiency era, the sub-$100M segment — the segment that constitutes the overwhelming majority of private SaaS companies and the majority of M&A deal volume by count — has produced essentially no profitability progress.

Figure 1: Operating margin by revenue cohort, 2024 vs. 2025. Gains concentrate above $100M. Source: OPEXEngine 2026 Benchmark Release / DevelopmentCorporate analysis.
This bifurcation is the first thing the cost data forces you to confront. “SaaS margins are improving” is true only as a weighted statement about large companies. For the typical private seller in the $10M–$100M band, the efficiency era has delivered slower growth without the compensating profitability — a combination that, as we showed in our Rule of 40 analysis of the same benchmark cohorts, leaves no OPEXEngine cohort clearing the Rule of 40 threshold. The question for everyone pricing these companies is what produced the gains where they did occur.
The Private Mid-Market Pattern: Cuts Without a Playbook
Before turning to the large-company story, it is worth dwelling on what the private mid-market data actually shows, because it contradicts the idea that there is a single cost-reduction playbook propagating down-market. OPEXEngine is explicit on this point: where companies are cutting differs significantly by size, and the smaller cohorts show a distinctly uneven pattern.
The $10M–$50M cohort cut R&D by 7 percentage points — the largest R&D reduction of any cohort in the dataset — while simultaneously increasing G&A by 4 points. OPEXEngine attributes the G&A increase to growth-stage investment in operational infrastructure: the finance systems, HR processes, and compliance scaffolding that companies at this stage must build before they can scale. The combination is revealing and, frankly, concerning. A cohort that is shrinking its product investment by 7 points while growing its administrative overhead by 4 is running its expense structure in reverse relative to value creation. Product is what buyers pay for; G&A is what they rationalize on day one of integration.
There is a charitable reading: sub-$50M companies over-hired engineering during the 2021–2022 capital glut and are now normalizing, while the G&A build-out is the deferred maintenance of professionalization. There is also an uncharitable reading: capital-starved companies are cutting the expense line with the longest feedback loop — product investment whose absence will not show up in churn and competitive losses for six to eight quarters — because it is the only line left to cut after the 2023–2024 GTM reductions. Both readings are present in the cohort. Diligence is how you tell them apart, and for buyers in the lower middle market, the 7-point R&D cut should now be a standard line of questioning in every process.
The $50M–$100M cohort, by contrast, held R&D flat and trimmed G&A 2–3 points, while the $100M–$500M cohort made the dataset’s deepest R&D cut at 8 points. Three adjacent cohorts, three different strategies. Whatever is driving SaaS cost cutting in the private mid-market, it is not a shared playbook — it is companies improvising against their individual cash positions and board pressure. That improvisation is precisely why the resulting EBITDA requires decomposition before it can be priced.
Follow the Cuts: S&M Is Carrying the Margin Story
OPEXEngine’s function-level data answers that question, and the answer is lopsided. Sales & Marketing reductions were the most consistent across cohorts, growing larger as companies scale. The standout figure: the $500M–$1B cohort cut S&M by 15 percentage points of revenue in a single year. That is not belt-tightening. For a cohort whose operating margin improved eight points over the same period, it is nearly the entire margin bridge.
Think about what a 15-point S&M reduction mechanically requires. At $750M of revenue, that is roughly $112M of annualized go-to-market spend removed — sales teams, field marketing, demand generation, events, partner programs. Some of that was undoubtedly waste; the post-ZIRP era left plenty of inefficient GTM capacity in place. But spend reductions of that magnitude are rarely surgical. They are structural reassessments of how much growth a company is willing to buy.
And that is the contrarian point the celebratory margin coverage misses: an S&M-driven margin is a trade, not a gift. Sales and marketing expense is the input side of future ARR. Cut it 15 points and you have converted tomorrow’s growth into today’s EBITDA. Whether that trade creates or destroys enterprise value depends entirely on the marginal productivity of the spend that was cut — something the expense ratio alone cannot tell you. Our analysis of how the 2026 go-to-market playbook is being rewritten found that GTM efficiency gains are achievable — but they show up as improved Magic Number and CAC payback, not simply as a smaller S&M line. A company that cut spend and held growth has genuinely re-engineered its motion. A company that cut spend and watched growth decelerate has simply harvested its pipeline.
The OPEXEngine growth data suggests the market contains plenty of both. Margin improved most where S&M fell most — but growth stabilization, not acceleration, accompanied it. For acquirers, this is the single most important diligence question of the 2026 vintage: decompose the margin bridge. How much EBITDA improvement came from S&M reduction, and what happened to new-logo bookings, pipeline coverage, and net revenue retention in the following two quarters?
Why this round of cuts differs from 2023
It is tempting to read the 2025 reductions as a continuation of the 2022–2023 efficiency wave, but the character of the cuts has changed. The first wave was crisis response: hiring freezes, layoffs announced in percentage terms, and across-the-board budget haircuts triggered by the repricing of growth when rates rose. It was fast, blunt, and broadly uniform. The 2025 wave visible in the OPEXEngine data is slower, deeper, and selective — 15 points out of S&M at one stage, 19 points out of G&A at another, R&D protected in some cohorts and raided in others. This is not panic; it is repositioning.
Two structural forces explain the difference. The first is the durable deterioration of go-to-market economics: sales and marketing efficiency, as measured by Magic Number and CAC payback, never recovered to pre-2022 levels, and boards have concluded that some portion of the old GTM spend simply never returns acceptable yield in a market where buyers run rigorous procurement and AI experimentation competes for every budget dollar. The second is the exit environment itself. With ARR-based lending gone and EBITDA-based underwriting now standard across private credit, companies positioning for a 2026–2027 exit or refinancing are manufacturing the earnings profile their counterparties demand. Some of that manufacturing is genuine operational improvement. Some of it is window dressing with a two-year fuse. The benchmark data cannot distinguish the two — which is exactly why buyers must.
The G&A Surprise: Where Durable Efficiency Actually Lives
The most analytically interesting number in the entire release belongs to the $1B–$5B cohort of the BVP Nasdaq Emerging Cloud Index: G&A declined 19 percentage points as a share of revenue, dwarfing the cohort’s R&D reduction (-5) and its nearly untouched S&M line (-1). Companies above $5B cut in a more balanced pattern — S&M down 3, R&D down 4, G&A down 6.

Figure 2: Expense change by function, BVP Nasdaq Emerging Cloud Index cohorts, 2025. Source: OPEXEngine 2026 Benchmark Release / DevelopmentCorporate analysis.
This inverts the pattern in OPEXEngine’s majority-private database, where companies up to $1B led with S&M cuts. OPEXEngine attributes the G&A collapse to the maturation of finance, HR, legal, and systems infrastructure at scale — investments that take years to build but compound once in place. We agree, and we would push the implication further: this is what durable margin looks like, and it is conspicuously not the margin most of the market is producing.
G&A efficiency is structural. It does not cannibalize future revenue the way S&M cuts can. It does not erode product competitiveness the way R&D cuts can. A company that has automated its quote-to-cash process, consolidated its systems stack, and right-sized its administrative overhead has built efficiency that survives a change of ownership and a change of strategy. That is precisely the kind of margin an acquirer should pay full multiple for — and precisely the kind that takes longest to build.
It is also worth noting what the G&A number quietly says about the AI narrative. Back-office automation — finance close, contract review, HR operations, support tooling — is where current-generation AI demonstrably works. If AI is creating measurable cost efficiency anywhere in the 2025 data, it is more plausibly hiding in this 19-point G&A reduction than anywhere in the R&D line. The irony: the least glamorous expense category may be the only place the AI efficiency story is actually visible in the financials.
R&D Refuses to Tell the AI Story the Market Is Pricing
Which brings us to the data point with the largest valuation consequences. The R&D line is where AI-driven engineering productivity — the thesis underwriting hundreds of billions of dollars of AI infrastructure spend and a meaningful share of current SaaS valuation premiums — should be showing up. It is not.
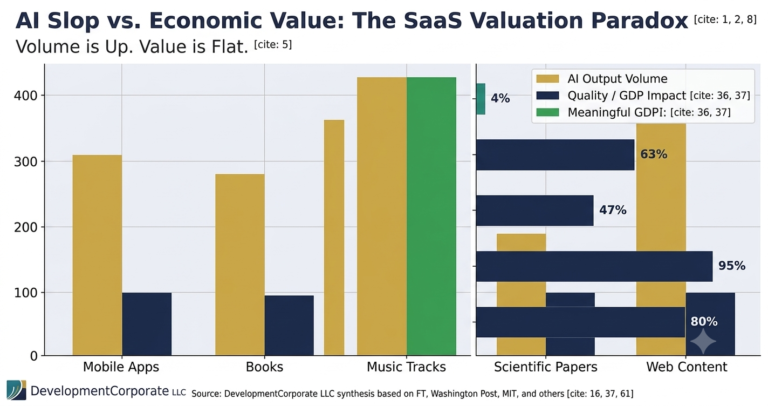
OPEXEngine is explicit: the data shows no uniform, across-the-board reduction in R&D costs that would indicate AI productivity gains are translating into lower operating expense. The $10M–$50M cohort cut R&D by 7 points and the $100M–$500M cohort by 8 — meaningful, but consistent with ordinary cost discipline and slower hiring. The $50M–$100M and $500M–$1B cohorts barely moved. The $1B+ cohorts declined a moderate 4–5 points. If AI coding tools were systematically deflating the cost of building software, the signature would be uniform and accelerating. Instead it is scattered and stage-dependent.

Figure 3: R&D change as % of revenue by cohort, 2025. No uniform AI-efficiency pattern. Source: OPEXEngine 2026 Benchmark Release / DevelopmentCorporate analysis.
OPEXEngine adds a detail that deserves more attention than a single sentence: anecdotal evidence points to AI efficiency gains being cannibalized by increased AI tooling and token costs. This matches everything we have documented over the past year. Our review of AI coding agents in enterprise environments found that verification overhead, review bottlenecks, and rework cycles absorb much of the headline velocity gain — developers merge more pull requests while review time balloons. Our analysis of AI ROI data from 6,000 enterprise executives found 80% of firms reporting zero measurable productivity impact from AI investment, with a cumulative measured boost of 0.29% over three years. And the 95%-no-measurable-return finding from MIT Media Lab research shows the same pattern on the go-to-market side. The OPEXEngine R&D data is the financial-statement confirmation of all of it: real adoption, real spend, no net cost deflation.
To be clear about what the data does and does not say: it does not prove AI is failing inside engineering organizations. Productivity gains may be getting reinvested — redirected into more output rather than lower cost — and R&D as a percentage of revenue will likely keep shifting as tools mature. But “the gains are being reinvested” and “the gains are being consumed by tooling and token costs” produce identical financial statements. From a buyer’s chair, an unverifiable productivity claim is a risk, not an asset. As we argued in our examination of the AI valuation gap in SaaS M&A, premiums are being paid for AI capability that buyers expect to see in the numbers. The 2026 benchmark release is the numbers. The capability is not visible in them yet.
The M&A Translation: Not All Margin Deserves the Same Multiple
Here is where the expense decomposition becomes a pricing exercise. The 2025 margin improvements will flow directly into 2026 deal models — trailing-twelve-month EBITDA is the denominator of every multiple, the basis of every debt covenant, and the anchor of every fairness opinion. But the OPEXEngine data demonstrates that identical EBITDA improvements can have radically different compositions, and composition determines durability.
Three margin archetypes, three different prices
The harvested margin. EBITDA produced primarily by deep S&M cuts, with growth decelerating in tow. This margin is real cash flow today and a growth problem tomorrow. It deserves the most skeptical treatment: buyers should model the reinvestment required to restore a competitive growth rate and subtract it from sustainable EBITDA. The private credit market has already made this adjustment — as we documented in our analysis of why SaaS lenders have abandoned ARR-based underwriting, underwriters now apply lender-grade scrutiny to earnings quality and durability. Equity buyers who do not apply the same scrutiny are systematically overpaying for harvested margin.
The structural margin. EBITDA produced by G&A and systems efficiency — the $1B–$5B pattern. This is the highest-quality margin in the dataset: it survives ownership changes, does not consume future revenue, and signals operational maturity that reduces integration risk. It merits a premium, and in competitive processes it will get one.
The ambiguous margin. R&D-driven margin improvement, which requires the deepest diligence of all. A 7–8 point R&D cut might reflect disciplined portfolio rationalization — or it might reflect deferred platform investment that the buyer will inherit as technical debt. OPEXEngine itself flags the risk: cutting R&D to hit a margin target without understanding what the spend supports is a danger the expense data alone cannot surface. Diligence teams should map R&D reductions against the product roadmap, security and compliance backlog, and — increasingly — the AI tooling spend that may be hiding inside the line.
A worked example: normalizing cut-driven EBITDA
Consider a hypothetical but representative target: $600M of revenue, sitting in the cohort that cut S&M by 15 points and expanded operating margin from 17% to 25%. Reported EBITDA is roughly $150M, and at the 15x–18x EBITDA multiples quality scaled SaaS assets command, the seller is marketing a $2.25B–$2.7B enterprise value. Now run the normalization. If diligence reveals that new-logo bookings declined 20% and pipeline coverage compressed from 3.5x to 2.4x in the quarters following the cuts, the buyer’s operating model must restore some portion of GTM capacity to sustain even the current growth rate. Restoring just 7 of the 15 cut points — half — removes $42M from run-rate EBITDA, taking the normalized figure to roughly $108M. At the same multiple range, that is a $630M–$750M reduction in supportable enterprise value. The same company. The same trailing financials. A 25–30% valuation swing, determined entirely by whether the buyer prices the composition of the margin or its headline.
This arithmetic is why the margin bridge is not an academic exercise. In 2021, buyers paid revenue multiples and growth covered all sins. In 2026, buyers pay earnings multiples — and the durability of those earnings is the entire negotiation. Sellers who arrive with the decomposition already done, with evidence that their cuts removed waste rather than capacity, control that negotiation. Sellers who arrive with only the headline number will have the decomposition done to them, on the buyer’s terms, at the buyer’s assumed reinvestment rates.
The questions the 2026 vintage demands
For any target showing 2025 margin expansion, the diligence sequence is straightforward. First, build the margin bridge by expense function: how many points came from S&M, R&D, and G&A respectively? Second, test growth durability: what happened to pipeline creation, new-logo ARR, and NRR in the two to four quarters following the cuts? Third, isolate the AI line items: how much new AI tooling and inference cost entered the P&L, and what offsetting savings are claimed and verifiable? Fourth, stress the run-rate: if the company had to restore growth-supporting spend to cohort-median levels, what does normalized EBITDA look like? The spread between reported and normalized EBITDA is the negotiation.
What This Means for Each Audience
| For PE/VC InvestorsTreat 2025-vintage EBITDA as a composite, not a number. Demand a function-level margin bridge for every platform and add-on target; price harvested S&M margin at a discount to structural G&A margin.The sub-$100M cohort’s margin stagnation (-6% to 0%) means the lower middle market has not earned the multiple expansion sellers are asking for. Portfolio marks built on “efficiency era” assumptions need revisiting.Do not underwrite AI-driven R&D deflation into your models. The benchmark data shows no uniform signal, and tooling/token costs are absorbing reported gains. |
| For SaaS Founders Approaching ExitIf you cut S&M in 2024–2025, your buyer will rebuild the bridge. Arrive with cohort-level CAC payback, Magic Number, and pipeline coverage data proving the cuts removed waste rather than growth capacity.G&A efficiency is the most defensible margin story you can tell. Systems consolidation, automated close processes, and lean administrative overhead survive diligence; pipeline harvesting does not.If AI tools are genuinely improving your engineering output, instrument it now — output per engineer, cycle time, tooling cost per developer. Unverifiable AI productivity claims are being priced as risk, not premium. |
| For Enterprise CTOs and CPOsThe R&D benchmark data is leverage in budget season: across six revenue cohorts, AI adoption has not produced uniform engineering cost reduction. Resist mandates premised on immediate AI headcount savings.Track AI tooling and token spend as a discrete budget line. The benchmark pattern — gains cannibalized by tooling costs — is invisible if inference spend is buried in general cloud costs.The 19-point G&A reduction at $1B–$5B shows where automation reliably pays: back-office systems, not speculative product AI. Sequence internal AI investment accordingly. |
Methodology Notes and Caveats
Three caveats should discipline how aggressively these benchmarks are applied. First, dataset composition: OPEXEngine’s proprietary database is majority private companies, validated directly with participants, while the $1B+ cohorts come from the BVP Nasdaq Emerging Cloud Index — public companies with different reporting incentives, stock-based compensation profiles, and disclosure standards. Comparing across the seam of those two datasets is informative but not apples-to-apples, particularly for G&A, where public-company costs include compliance burden private companies do not carry.
Second, percentage-of-revenue arithmetic cuts both ways. An expense line can fall as a share of revenue because spending dropped or because revenue grew. For the cohorts that combined margin expansion with continued growth, some portion of the “cuts” is denominator effect rather than absolute reduction. The diligence implication is to always request absolute dollar expense trends alongside the ratios — a discipline that also exposes the reverse problem, where flat ratios conceal absolute spending growth.
Third, the benchmark data describes cohort medians, not destinies. Within every cohort sit companies that re-engineered their cost structure intelligently and companies that strip-mined their growth engine to manufacture a sale-ready EBITDA line. The benchmarks tell you what questions to ask; they do not answer them for any individual target. That is what diligence — and frameworks like our M&A due diligence checklist — are for.
Conclusion: Price the Composition, Not the Headline
The 2026 OPEXEngine release confirms that SaaS cost cutting is working — in the narrow sense that expenses are falling and margins are rising where companies are large enough to have margin to find. But the data dismantles two comfortable assumptions in the same breath. The first is that margin expansion reflects broad operating leverage; in reality it is concentrated, stage-specific, and heavily dependent on a go-to-market retrenchment whose growth cost has not yet been fully booked. The second is that AI is already deflating the cost of building software; the R&D line says otherwise, and the gap between AI narrative and AI financials is becoming a measurable macro phenomenon rather than a contrarian talking point.
For operators, the prescription is OPEXEngine’s own, sharpened: the strongest performers found efficiency in the right functions for their stage. For buyers and sellers, the prescription is ours: the right functions also determine the right price. A dollar of G&A-driven EBITDA, a dollar of S&M-harvested EBITDA, and a dollar of R&D-deferred EBITDA are not the same dollar. The 2026 deal market will be won by the parties who price that difference first.
Looking forward, expect the composition problem to intensify rather than resolve. The S&M lever, once pulled 15 points, cannot be pulled again; the cohorts that led with GTM cuts will need a new margin source in 2026, and the candidates — R&D rationalization, G&A automation, or pricing — each carry their own risks and timelines. Meanwhile, R&D ratios will keep shifting as AI tooling costs and claimed productivity offsets fight to a draw on the income statement, making year-over-year comparisons noisier just as buyers lean on them hardest. The benchmark releases of 2027 will adjudicate which 2025 cutters re-engineered and which merely harvested. The deals signed between now and then will not have the luxury of waiting for that verdict.DevelopmentCorporate advises enterprise SaaS companies and investors on exit strategy, acquisition diligence, and valuation positioning. If you are evaluating a 2026 exit or pricing a target whose margins improved in 2025, contact us for a confidential discussion of how expense composition should inform your process.