The 2025 SaaS Metrics That Matter Most for $1M–$5M ARR Startups
How early-stage SaaS CEOs can translate retention, CAC, and expansion metrics into sustainable, capital-efficient growth.
Introduction: Metrics That Define the Post-Reset SaaS Era
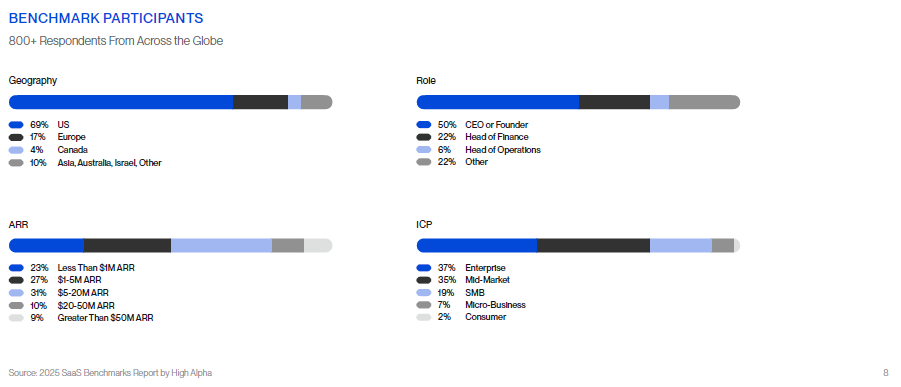
In 2025, the SaaS industry has stabilized after several turbulent years of market correction. According to the High Alpha 2025 SaaS Benchmarks Report, more than 800 founders, CEOs, and operators shared their financial and operating data—making it one of the most comprehensive data sets available to the startup community.
The report’s $1 M to $5 M ARR cohort represents the most critical stage in the SaaS journey: the point where founders must shift from product-market fit validation to repeatable, scalable growth.
Companies at this stage face three realities:
- Growth is slowing from triple digits, but investors expect evidence of scalability.
- Retention discipline now outweighs raw logo growth.
- AI infrastructure costs and hybrid pricing models are reshaping gross margins.
This post breaks down the SaaS Metrics & Trends section of the report—specifically for early-stage CEOs navigating the $1 M–$5 M ARR range—and explains what each trend means for your next year of growth.
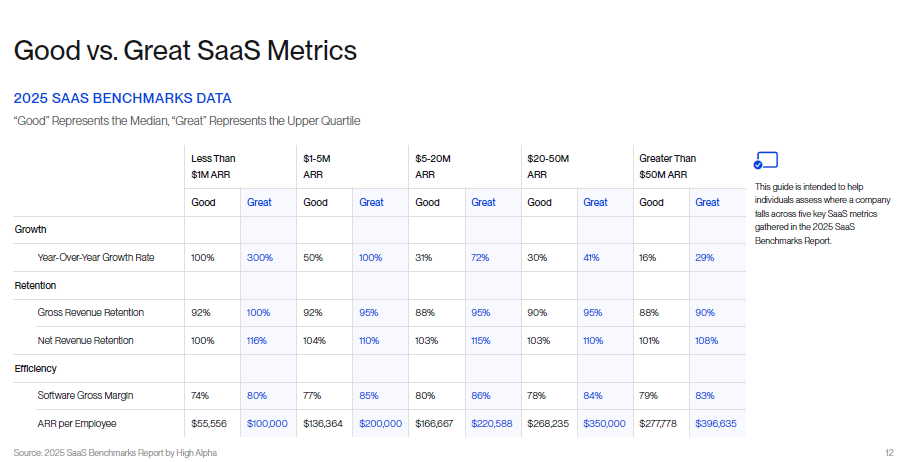
1. Gross Revenue Retention: Stabilizing Near 92% but Still Fragile
For startups between $1 M and $5 M ARR, Gross Revenue Retention (GRR) remains steady around 92%, slightly down from 95% the previous year.
This stability suggests most founders have achieved reasonable customer stickiness—but also reveals that churn control remains one of the most fragile levers in early-stage SaaS.
CEO Takeaways
- A 90–92% GRR implies 8–10% annual customer churn—acceptable for B2B SaaS, but too high for scalable profitability.
- The best-in-class companies in this band achieve 95%+ GRR, often through customer onboarding excellence and usage-driven engagement metrics.
- Retention initiatives deliver 2–3× more lifetime ARR impact than equivalent acquisition spend.
Action Plan
- Formalize a Customer Health Score integrating usage frequency, NPS, and product depth.
- Add a customer-success review 30 days before renewal to surface friction.
- Treat onboarding as a revenue-preservation function—not an implementation project.
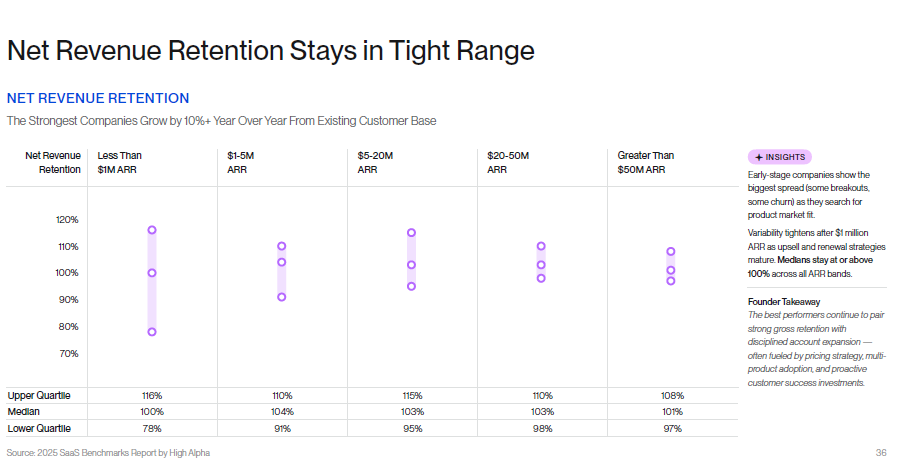
2. Net Revenue Retention: Expansion Offsets Churn
The median Net Revenue Retention (NRR) for the $1 M–$5 M cohort sits at 104%, while the upper quartile reaches 110%—proof that expansion revenue can more than compensate for churn when managed intentionally.
As early-stage companies begin layering add-ons, AI features, or usage-based tiers, expansion becomes the first sign of scalable economics.
CEO Takeaways
- Moving NRR from 100 → 110% effectively adds 10 points to growth without new logo spend.
- Expansion ARR correlates directly with higher Rule of 40 scores and lower CAC payback.
- High NRR signals product-market fit maturity and readiness for Series A funding.
Action Plan
- Build an expansion pipeline: track upgrade opportunities the same way you track new deals.
- Incentivize Customer Success Managers on NRR, not renewal count.
- Experiment with hybrid pricing (subscription + usage) that scales with delivered value.
3. CAC Payback: Efficiency Plateaus Around 8 Months
The High Alpha data shows the median CAC payback at 8 months for this stage, nearly unchanged from 2024.
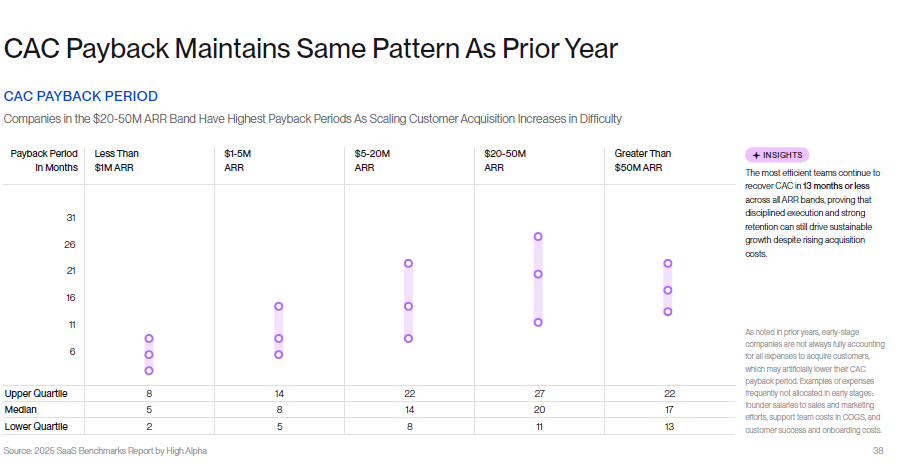
Top-quartile firms achieve 5-month payback, while slower-growing peers exceed 14 months. However, many startups underestimate CAC by excluding founder labor or customer-success costs.
CEO Takeaways
- Treat CAC payback > 12 months as a warning signal—it usually indicates inefficient pipeline qualification.
- Under 6 months demonstrates strong PLG or sales-assist efficiency.
- Investors increasingly view CAC payback as a proxy for capital discipline rather than marketing aggressiveness.
Action Plan
- Attribute all founder and post-sale effort to CAC for accuracy.
- Shift budget toward channels with shorter sales cycles (events, referrals, and content).
- Deploy AI-powered lead-scoring to focus reps on accounts with the highest win probability.
4. Retention × CAC = The Growth Multiplier
When companies pair NRR > 106% with CAC payback < 10 months, their median growth rate jumps to 70%, nearly double peers in the same cohort.
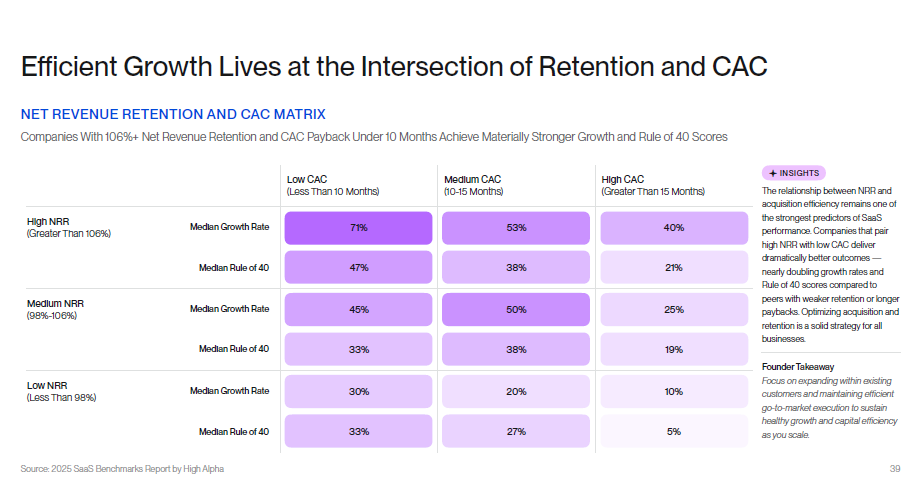
This relationship—retention plus efficiency—defines the new model of “durable growth.”
CEO Takeaways
- Chasing rapid logo acquisition without retention discipline leads to CAC inflation.
- Efficient growth requires aligning marketing, sales, and success teams under one shared metric: Customer Lifetime Value / CAC ratio > 3.
Action Plan
- Integrate NRR and CAC data into a monthly “growth efficiency dashboard.”
- Use Rule of 40 (growth + profitability) as your north star.
- Celebrate renewals and expansions with the same visibility as new logos.
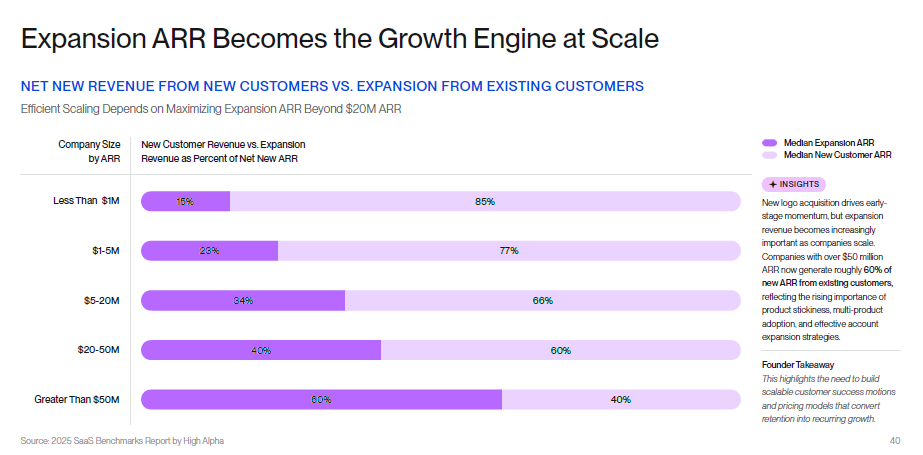
5. Expansion ARR Becomes the Engine After $2 M ARR
Beyond $2 M ARR, expansion revenue drives 40–60% of new ARR in this segment. Early-stage SaaS firms that systematize customer success early convert retention into compounding growth.
CEO Takeaways
- Upsell motion: Prioritize product add-ons or AI-powered features customers can enable quickly.
- Cross-sell motion: Introduce companion modules that align with usage patterns.
- Customer advocacy motion: Use expansion success to fuel referrals.
Action Plan
- Create a Customer Growth Scorecard showing account expansion potential.
- Use in-app analytics to trigger expansion campaigns at usage milestones.
- Reward Customer Success and Sales teams jointly for expansion deals.
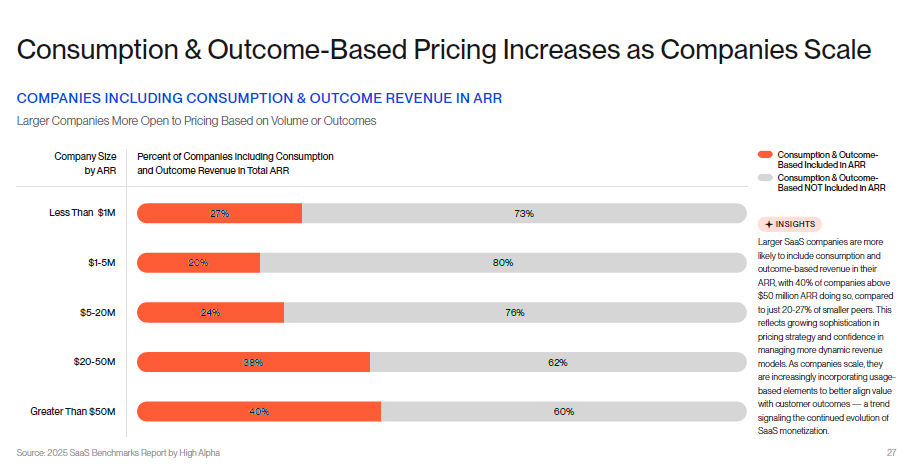
6. Pricing Innovation: Hybrid and Outcome-Based Models Rise
The report highlights a decisive shift toward variable pricing. Roughly one-third of $1 M–$5 M ARR firms are experimenting with hybrid (subscription + usage) or outcome-based models.
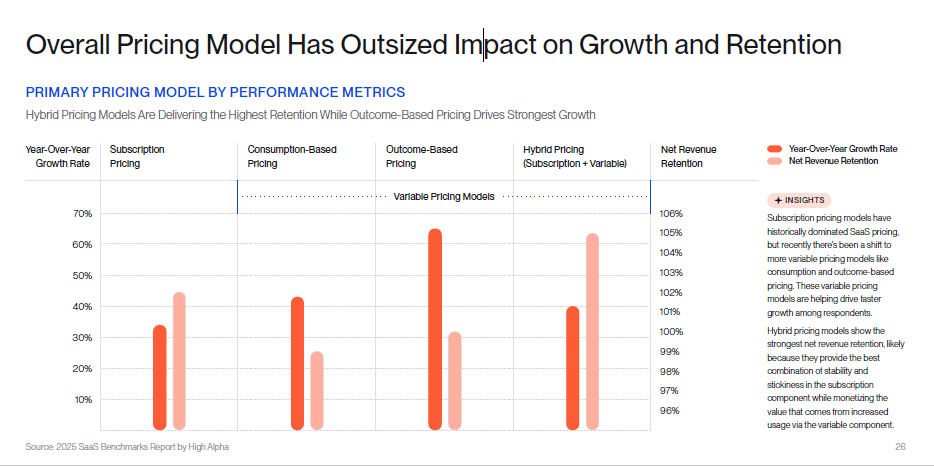
Hybrid pricing shows the highest NRR (≈ 104–107%), while outcome-based pricing delivers faster year-over-year growth—especially in B2B vertical SaaS where ROI is measurable.
CEO Takeaways
- Traditional seat-based pricing struggles to capture AI-driven usage spikes.
- Usage and outcome models align revenue with delivered value, improving retention.
- Investors increasingly value pricing flexibility as a signal of operational sophistication.
Action Plan
- Introduce usage-based tiers tied to measurable outcomes (API calls, datasets processed, automations triggered).
- Communicate value transparently—customers pay for what they gain, not for what they fear losing.
- Monitor churn risk: rapid adoption of variable pricing can create billing volatility if usage dips.
7. Mid-Range ACVs Deliver the Best Blend of Growth and Retention
According to the dataset, ACVs between $10K and $100K yield the best performance balance for this stage:
- Median YoY Growth ≈ 30–40%
- GRR ≈ 90%
- NRR ≈ 104%
Deals below $10K suffer from churn; deals above $100K strain small teams with long sales cycles.
CEO Takeaways
- The mid-market sweet spot is where PLG velocity meets enterprise retention.
- Focus on scalable pricing frameworks that let small customers grow into large ones.
- Avoid enterprise bloat until your sales motion can handle six-month procurement cycles.
Action Plan
- Define clear ACV segmentation tiers: SMB, Mid-Market, Enterprise.
- Align pricing pages and sales comp plans around these tiers.
- Use AI-driven forecasting to track expansion probability by contract size.
8. Go-To-Market Channels: Direct Sales Still Dominates
Nearly 40% of companies in the $1 M–$5 M ARR group rely on direct sales as their primary GTM channel.
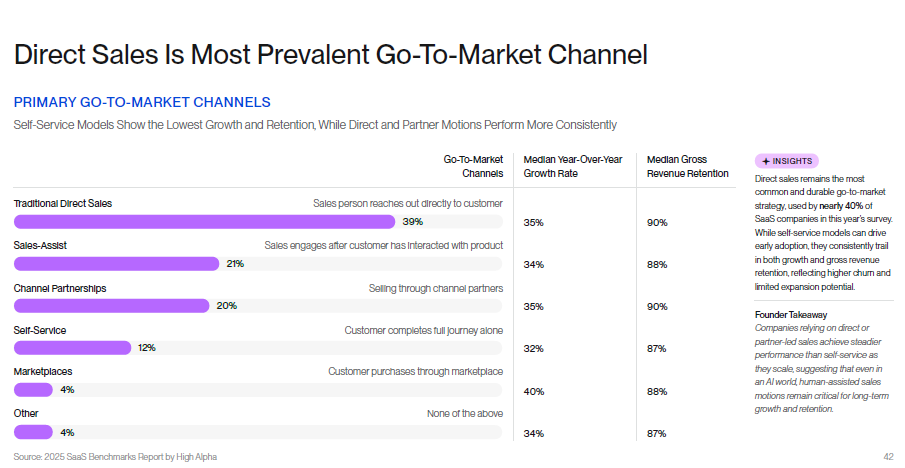
While self-service and marketplaces drive early adoption, they underperform on retention and lifetime value. Events and in-person interactions (“IRL FTW”) have re-emerged as top growth channels in 2025.
CEO Takeaways
- Even in an AI-automated era, human-assisted sales build trust faster in B2B.
- SEO and content marketing scale well, but only after a strong direct motion is established.
- Channel partners and affiliate programs remain underutilized in this band.
Action Plan
- Maintain a founder-led sales presence for high-signal accounts.
- Layer in sales-assist motions for inbound leads (demo + trial + success check).
- Add events, roundtables, and conferences to the GTM mix—these drive conversion and brand legitimacy.
9. Gross Margin Pressure: The AI Cost Reality
Smaller SaaS firms are feeling the squeeze from AI-related infrastructure expenses. For $1 M–$5 M ARR companies, median software gross margin fell 4% YoY to 77%, while larger firms stayed near 80%.
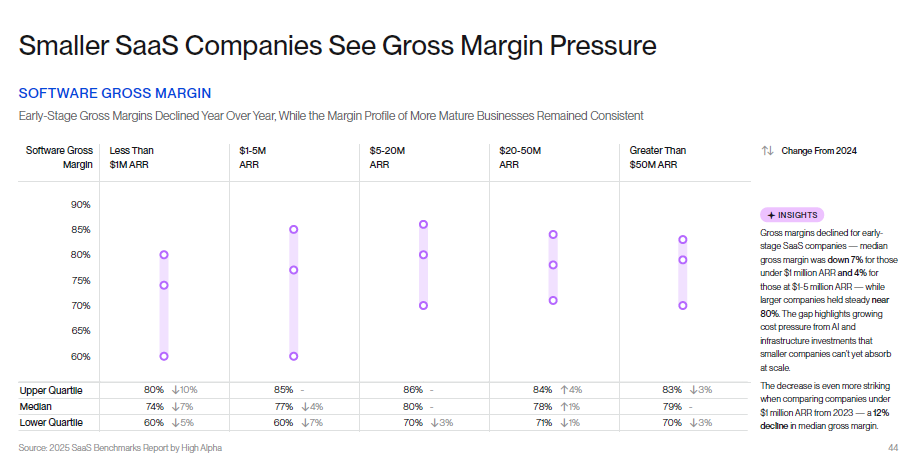
CEO Takeaways
- Compute and model-inference costs are eating into margins faster than pricing adjustments can offset them.
- Early-stage firms often over-commit to expensive GPU resources or third-party AI APIs.
- Investors now scrutinize unit economics of AI features, not just adoption stories.
Action Plan
- Implement usage-based cost tracking for every AI feature (per inference, per token, etc.).
- Explore LLM cost-optimization platforms or smaller model fine-tunes.
- Pass part of the cost to customers transparently through hybrid pricing.
10. Efficiency Benchmark: Rule of 40 Still Out of Reach—But Closing
For $1–5 M ARR companies, median Rule of 40 performance hovers around 33%, below the efficiency threshold but trending upward.
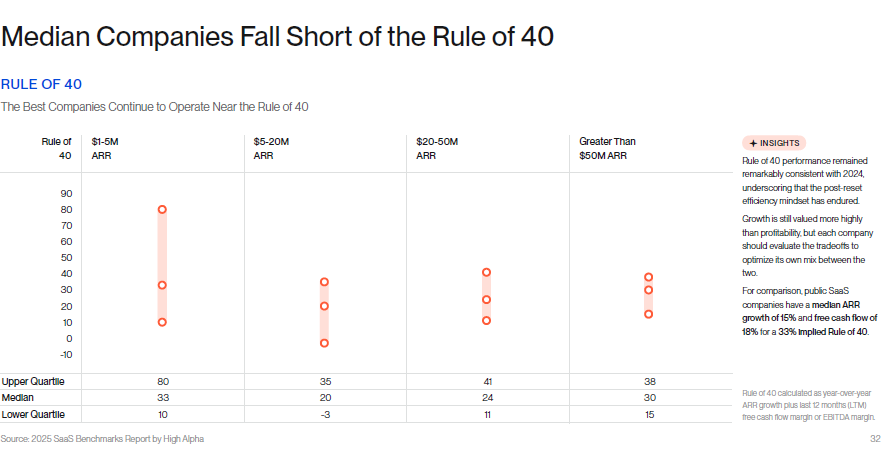
Top-quartile performers reach 80%, demonstrating that strong retention and disciplined CAC management can offset lower margins.
CEO Takeaways
- Growth remains valued over profitability—but efficiency now drives investor confidence.
- Achieving Rule of 40 > 30% is a solid pre-Series A milestone.
Action Plan
- Track ARR growth + free-cash-flow margin monthly.
- Introduce a light financial operating rhythm (forecast → actual → adjust) every quarter.
- Use automation and AI tools to compress non-differentiated work and redeploy talent toward revenue-impact roles.
11. Founder Mindset: Efficiency Is the New Growth
The High Alpha report emphasizes that for 2025 SaaS builders, efficiency is not a constraint—it’s a competitive advantage.
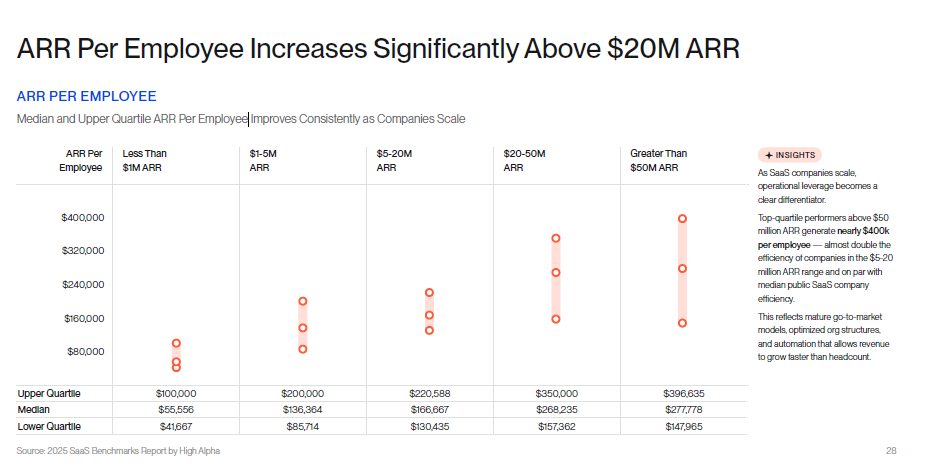
Companies in the $1–5 M band employ a median of 22 people, generating roughly $136K ARR per employee. Top-quartile firms reach $200K—proof that lean, automation-centric teams outperform headcount-heavy peers.
CEO Takeaways
- Growth doesn’t require size; it requires focus, systems, and intelligent leverage.
- AI tools can help early-stage teams achieve enterprise-level productivity without enterprise-level costs.
- Efficiency today buys optionality tomorrow—runway, investor confidence, and valuation strength.
12. Key Benchmarks Summary (2025 $1M–$5M ARR Cohort)
| Metric | Median | Upper Quartile (“Great”) | Implication for CEOs |
| YoY Growth Rate | 50% | 100% | Sustainable if paired with CAC discipline |
| Gross Revenue Retention | 92% | 95% | Focus on churn-prevention programs |
| Net Revenue Retention | 104% | 110% | Proves expansion readiness |
| Software Gross Margin | 77% | 85% | Monitor AI cost structure |
| CAC Payback | 8 months | 5 months | Target < 10 months for healthy cash flow |
| ARR Per Employee | $136K | $200K | Optimize org design & automation |
| Rule of 40 | 33% | 80% | Balance growth & efficiency |
13. How CEOs Should Apply These Benchmarks
a. Benchmark Thoughtfully, Not Blindly
Benchmarks are signals, not rules. Compare your metrics to companies at your same ARR stage, not public SaaS leaders with 10× scale and 5× headcount.
b. Build an Operating Cadence
Review key metrics quarterly, not daily. Tie each KPI to owner accountability and system improvements. Use benchmarks to set board-level expectations—especially around CAC payback and NRR.
c. Translate Data Into Narrative
When fundraising, investors don’t just want numbers—they want stories about why your numbers look the way they do.
For instance:
- “Our NRR rose 6 points after switching to hybrid pricing.”
- “We compressed CAC payback by 3 months after integrating AI-based lead scoring.”
These narratives show mastery over your metrics, not mere awareness.
14. The Bigger Picture: Operation AI and the Future of SaaS Metrics
High Alpha frames 2025 as the era of “Operation AI”—a shift from AI experimentation to AI execution.
For $1 M–$5 M ARR companies, that means:
- Embedding AI deeply into workflows, not just as a feature.
- Using AI to drive productivity, retention, and pricing precision.
- Viewing intelligence—human and machine—as a managed, compounding asset.
Metrics are evolving in this environment. CAC, NRR, and margins will increasingly reflect automation leverage and AI unit economics. Founders who operationalize these early will outpace peers who merely build around them.
15. Conclusion: The Path From $1M to $5M to $20M
Crossing $1M ARR is proof that your product solves a real problem. Crossing $5M ARR requires proving you can do it efficiently, repeatedly, and profitably.
The 2025 SaaS Benchmarks Report makes one theme unmistakable:
“Efficient growth lives at the intersection of retention and CAC.”
For early-stage CEOs, that intersection is your roadmap to capital-efficient scaling. Build systems around retention, master your CAC, and let expansion ARR compound the results.
16. Methodology of the 2025 High Alpha SaaS Benchmarks Report
The High Alpha 2025 SaaS Benchmarks Report is based on a survey of over 800 SaaS companies worldwide, marking the ninth consecutive year of publication. The study was conducted in partnership with more than 40 venture and platform partners, gathering quantitative and qualitative insights from founders, CEOs, and senior finance and operations leaders. The 2025 dataset is the largest and most geographically diverse in the report’s history, with respondents from North America, Europe, and Asia-Pacific representing a wide range of ARR bands—from under $1M to over $50M.
All participants self-reported their data across standardized SaaS financial and operating metrics, including ARR growth, CAC payback, Gross and Net Revenue Retention, Software Gross Margin, Rule of 40 performance, and R&D and S&M spending as a percentage of ARR. High Alpha then normalized these figures by quartile (lower, median, upper) to enable consistent comparison between companies of different sizes. The report defines the $1M–$5M ARR group as the pivotal early-scale segment, balancing product-market fit validation with the pursuit of efficient growth.
Data covers the period from Q2 2024 through Q2 2025, allowing direct year-over-year comparison to previous benchmark editions. High Alpha’s analysts combined this quantitative data with qualitative founder insights to identify behavioral and structural traits of top-performing SaaS companies. Key analyses correlate retention, CAC efficiency, pricing innovation, and AI adoption with growth rates and Rule of 40 performance.
While self-reported data introduces limitations—such as incomplete CAC allocation or margin inconsistencies—the report remains one of the most reliable macro views of private SaaS performance. High Alpha’s longitudinal dataset, spanning nearly a decade, provides an invaluable baseline for founders and investors benchmarking growth, efficiency, and valuation readiness in the new era of AI-driven SaaS.