Product Management Competitor Business Intelligence
Competitive intelligence is a core responsibility of product management. There is more to competitive intelligence than understanding the features and functionality of competitive solutions. Product managers need to understand competitors’ revenues, headcount, funding, industry analyst relations, global footprint, and enterprise value. Product managers need to understand the business aspects of their competitors and how they stack up against their own business. Fortunately, there are many free resources and tactics product managers can use to learn about these items.
Competitor Business Intelligence
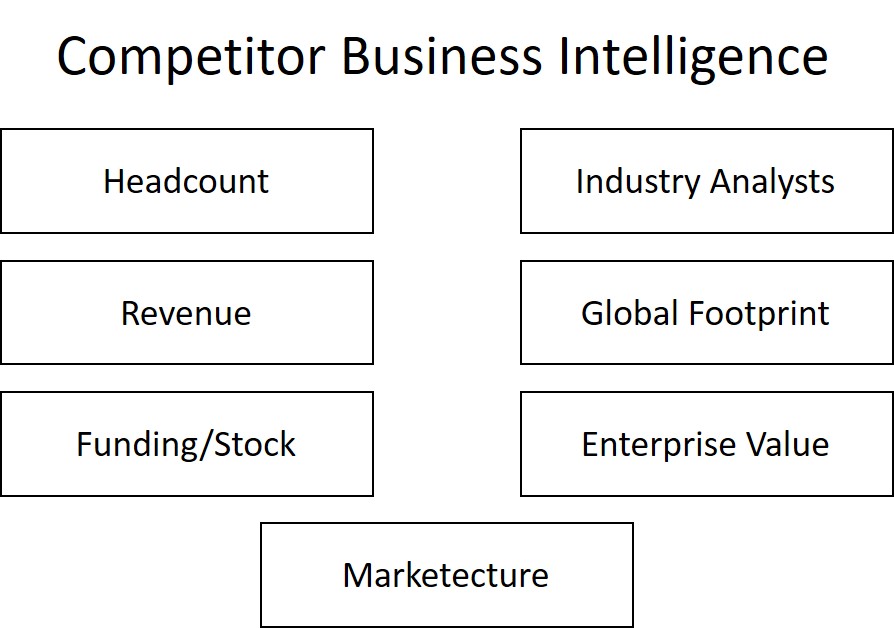
There are many topics product managers need to cover in competitive analysis. There are a group of topics that relate to the competitor’s business, yet are rarely covered in most sales/competitive battle cards. Understanding some facts about the competitor’s business is extremely valuable. There are seven topics you should explore include:
There are many free sources of information product managers can leverage to learn about these topics. These sources can work for competitors that are public companies, as well as privately held.
Competitor Headcount
Headcount and staffing are key metrics for software companies. If your company has 300 employees and you are competing against a company that has 3,000 employees, things can be tough. Understanding competitors’ headcount and staffing is important. There are two easy free ways to find a competitor’s headcount: Google and LinkedIn.
Using Google to Find Competitor Headcount
Using Google is the easiest. Simply search for company name + employees – “How many employees does Google have?” 90% of the time, Google can provide an answer:
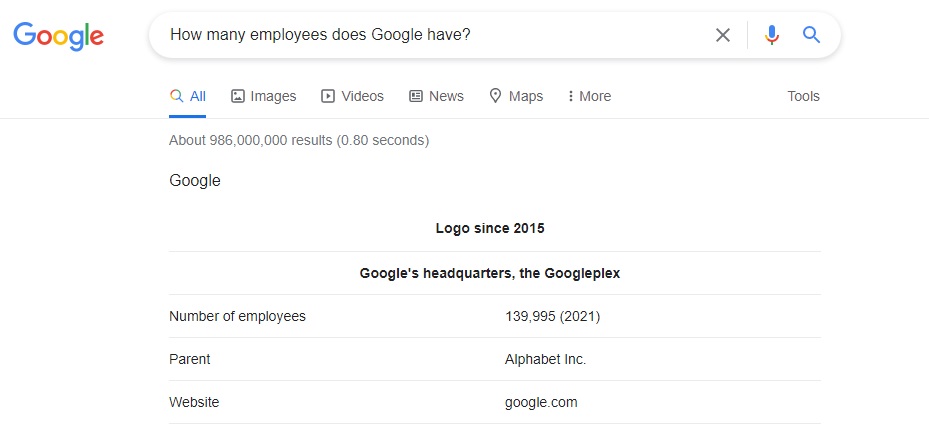
Public companies, like Google, report their headcount every year in their annual 10-K filings with the SEC. Finding the headcount for privately held companies is easy too.
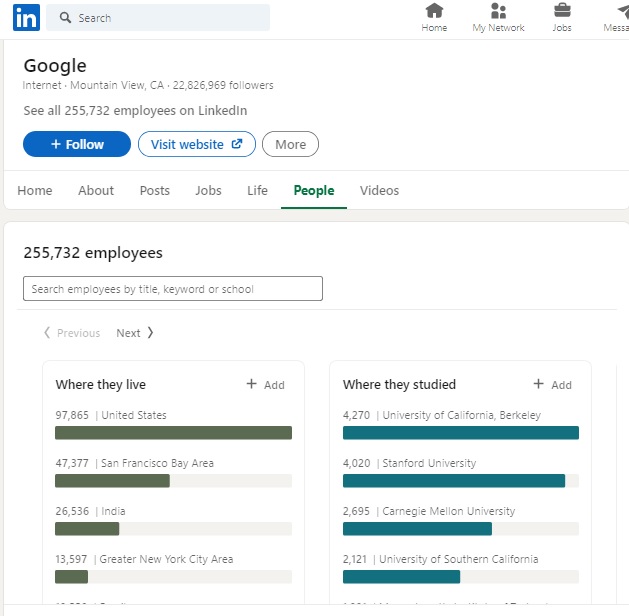
LinkedIn is a great source of competitive business intelligence for both public and private companies. Simply search for the company name and drill into LinkedIn’s company profile. LinkedIn can show the total number of employees as well as where they are located:

You can also see headcount by major business function:
You can even search by job title. Say you wanted to learn how many people at Google were involved in product management. You can narrow the search:
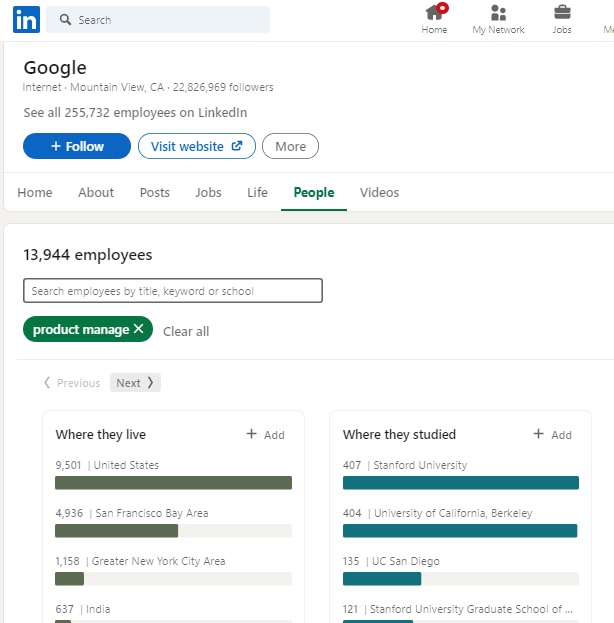
It is important to note that there are limitations to LinkedIn’s free search capabilities. Free search results will include current as well as past employees. If you upgrade to LinkedIn’s premium offering ($29.99/month) you get additional search filters, one of which is current employees only.
LinkedIn is extremely valuable in researching privately held companies. In a recent consulting sales process I needed to research the EdTech market. While I had been involved in EdTech 20 years ago, I needed to brush up on my sales opportunity and their marketplace. LinkedIn was very helpful in assessing the headcount of the various market players, and how many employees each company had in marketing, sales, engineering, operations, and finance.
Competitor Revenues
Competitive revenues are a critically important fact. You need to be able to understand the scale and composition of your competitor’s revenues. You should be able to analyze trends in competitor revenues and other financial items like gross margins, net dollar retention, deferred revenues, operating expenses, and debt. For public software companies, this is fairly easy. For private companies, you have to rely on estimates and industry averages.
Public Software Companies
Publicly traded software companies are required to file detailed reports with the Securities & Exchange Commission (SEC). You can access these reports for free on the SEC website SEC.gov. You can download most financial statements in Excel format. Here is a quick summary of one of the companies I researched for my EdTech sales prospect, 2U (Nasdaq: TWOU):
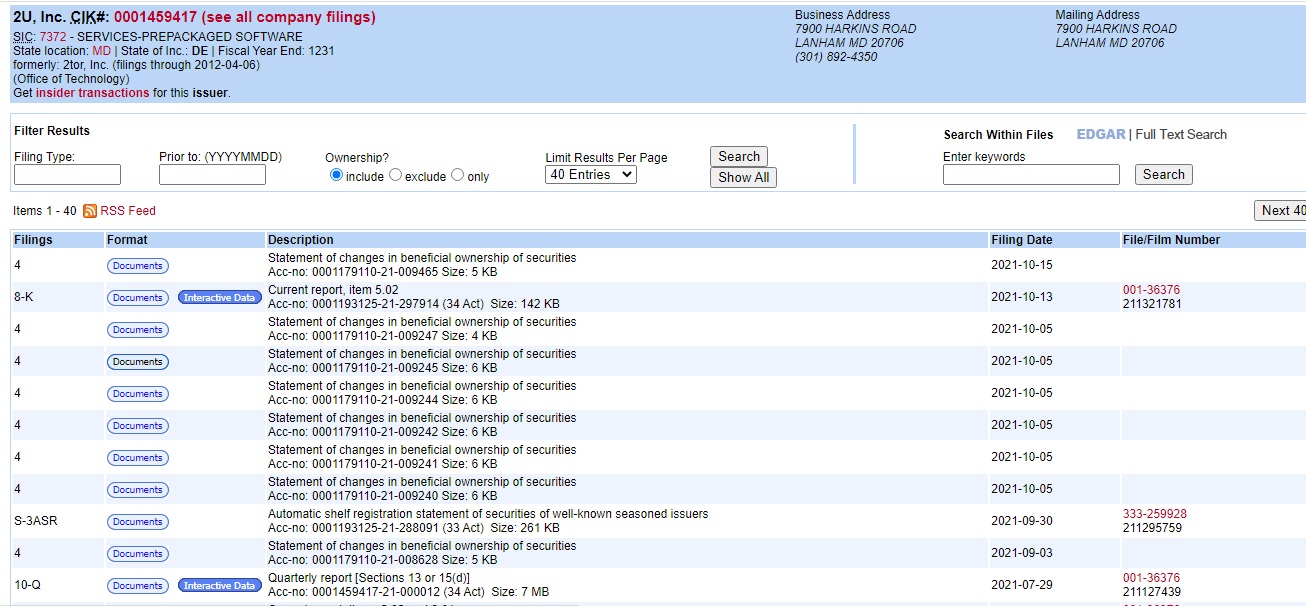
The blue button labeled “Interactive Data’ leads to another screen where you can download the filing as an Excel file:
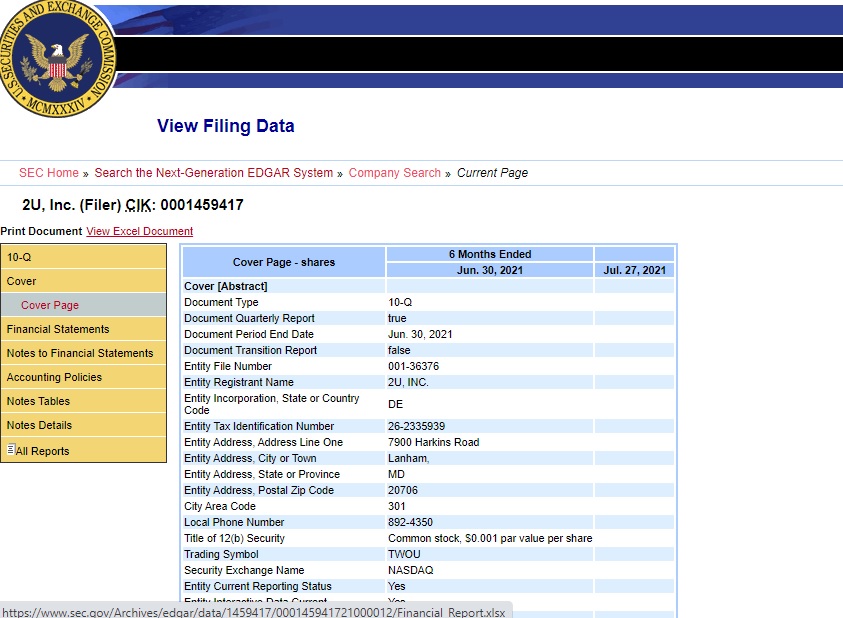
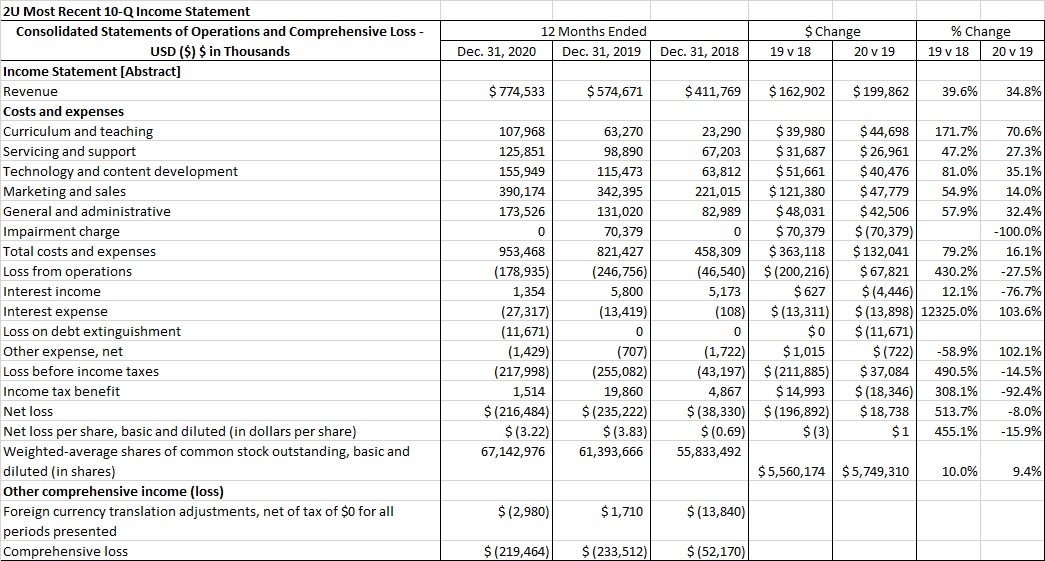
In the Excel file, you can see and analyze Income Statements (P&L), Balance Sheets, and Cash Flow Statements. Here is 2U’s most recent quarterly Income Statement (P&L):
Income Statement
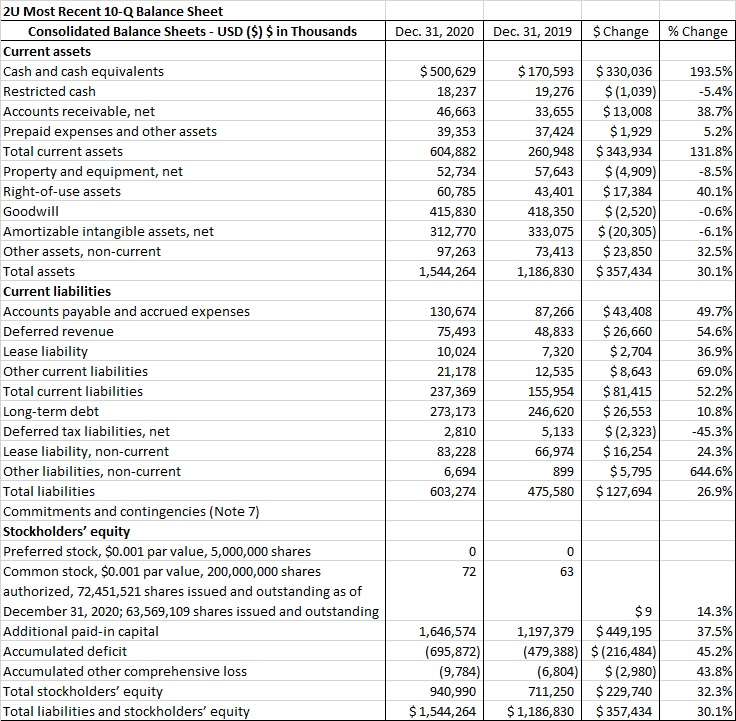
Balance Sheet
Cash Flow Statement
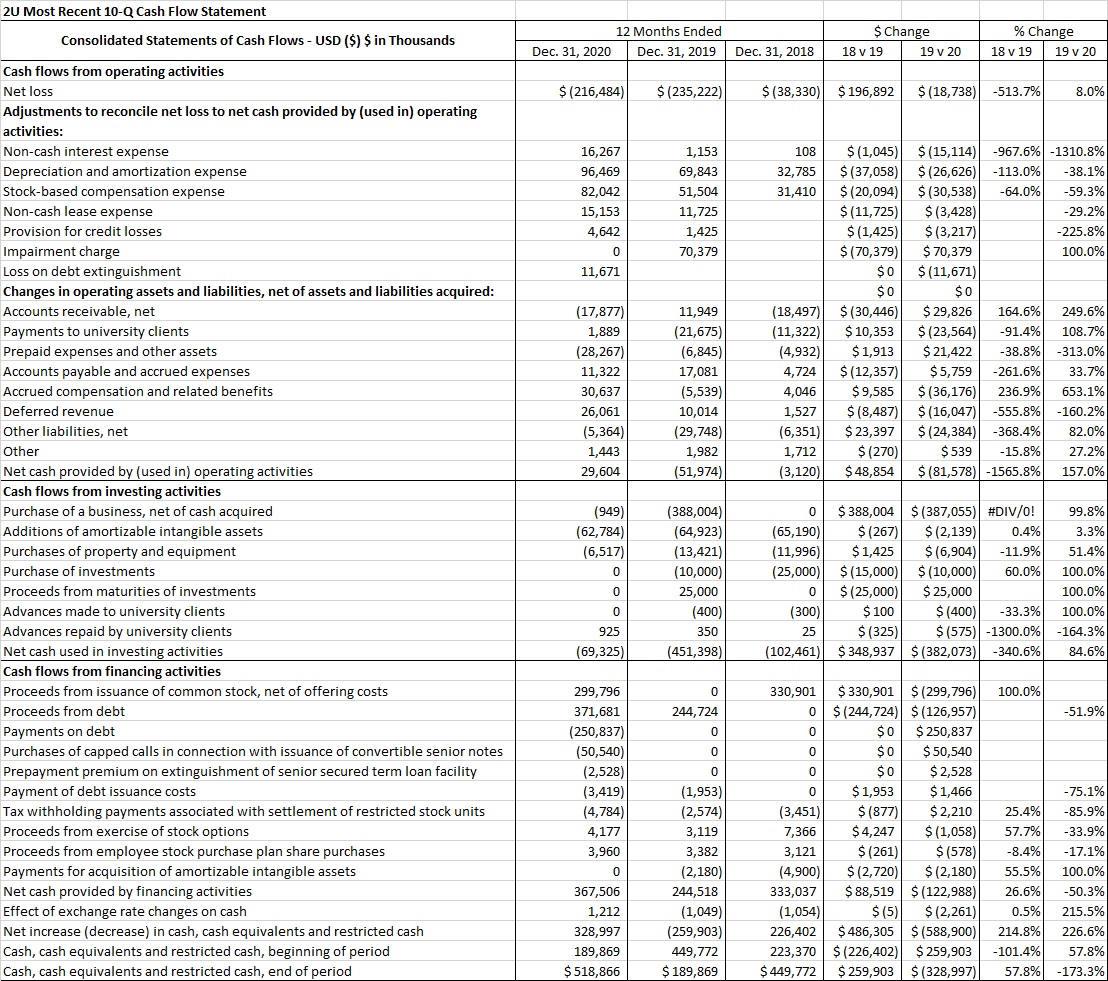
One of the great things about public filings like 10-Ks is that revenue information is reliable and accurate. Publicly filed financial statements have to be audited by an independent auditor, and their ‘audit letter’Thanks to the Sarbanes-Oxley Act, CEOs, and Chief Accounting Officers have to certify the accuracy of their financial statements and the effectiveness of internal controls.,
Public regulatory filings like 10-K Annual Reports, 10-Q Quarterly Reports, DEF 14A Annual Meeting & Proxy Statements, and S-1 Registration Statement provide a wealth of competitive information. To learn more, check out Why Product Managers Need to be Able to Read 10-K Filings
If you need to bone up on your financial literacy, check out:
- Product Managers Should Understand SaaS Revenue Basics
- Why Should Product Managers Care About Income Statements?
- Why Should Product Managers Care About Balance Sheets?
- Why Product Managers Should Care About Cash Flow Statements
- Why Product Managers Should Care About Goodwill
Private Company Revenues
Unfortunately, there is no SEC.gov for private companies. There are paid subscription services that provide confidential information, and some free services as well. There are also techniques you can use to estimate private company revenues by leveraging publicly available data.
Paid Services
Paid services like Pitchbook, DealRoom,, PrivCo, and CBInsights, offer insights into private company financials. Sometimes they have access to financial statements. These services are not cheap – the lowest Pitchbook subscription is $20K/year, prepaid. You might ask your company’s corporate development executive if they have access and would be willing to share it.
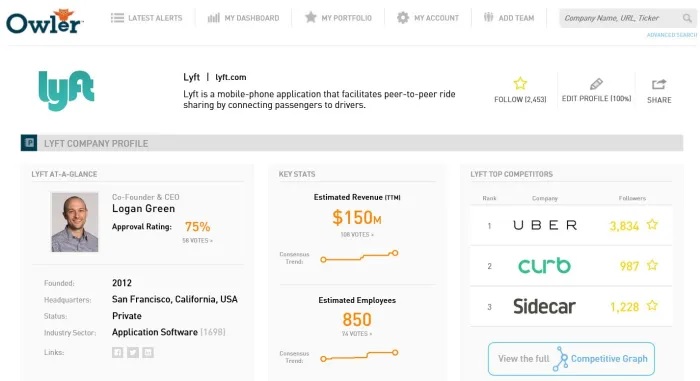
Owler.com
Owler is a crowd-sourced research site that provides overviews of private companies, including revenue estimates. They offer a limited free plan and two paid plans. Here is an example of an Owler summary:
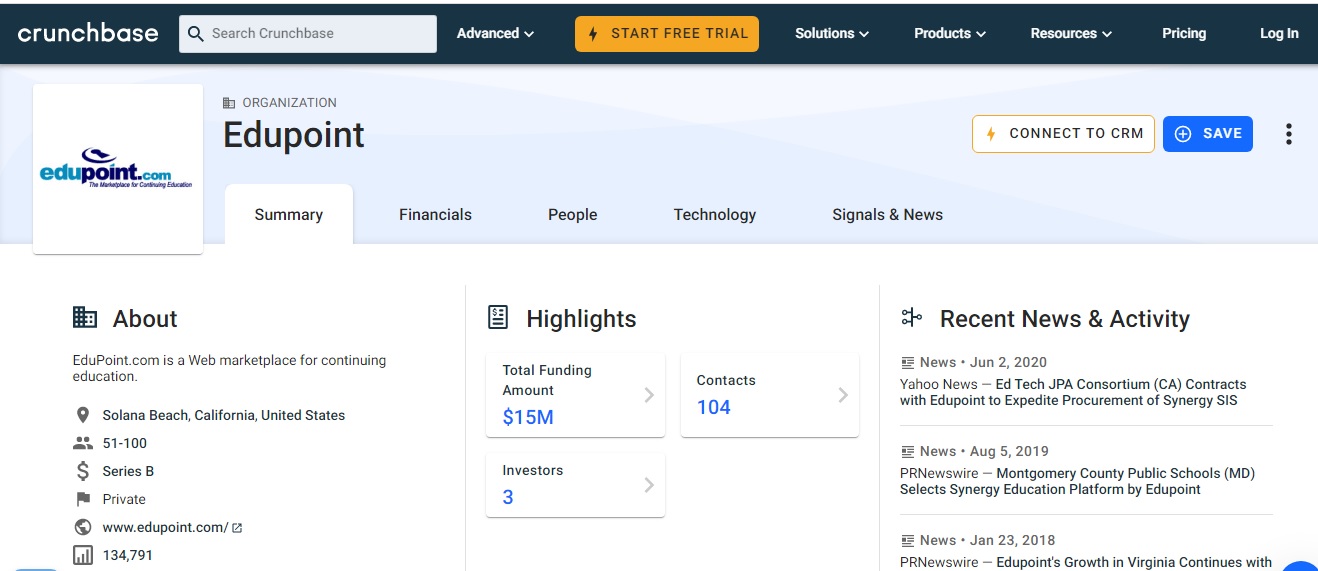
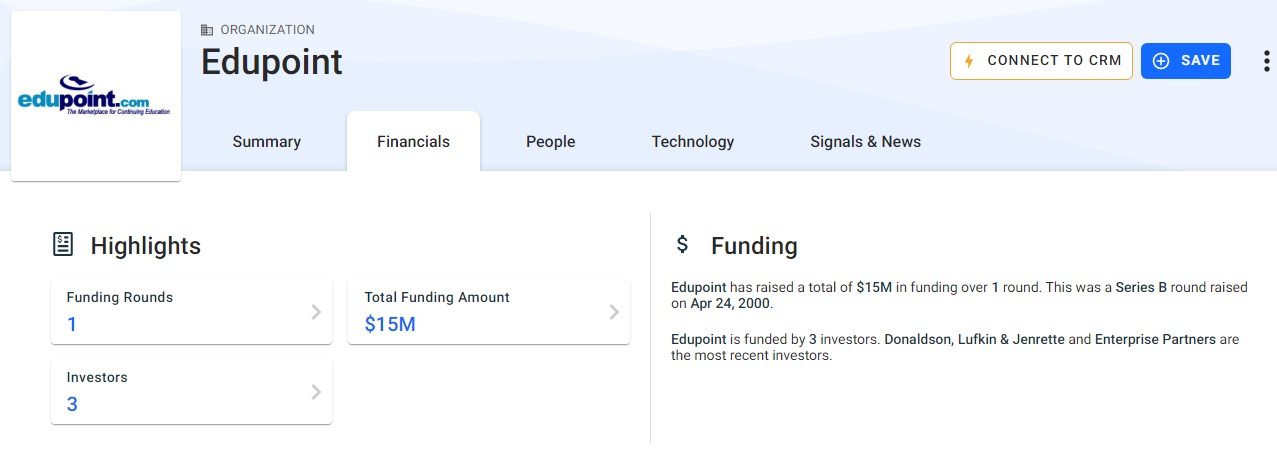
Crunchbase.com
Crunchbase is a service that provides good research information, especially for venture-backed companies. Like Owler they offer limited free information and paid options from $29 to $49 a month. Here is an example:
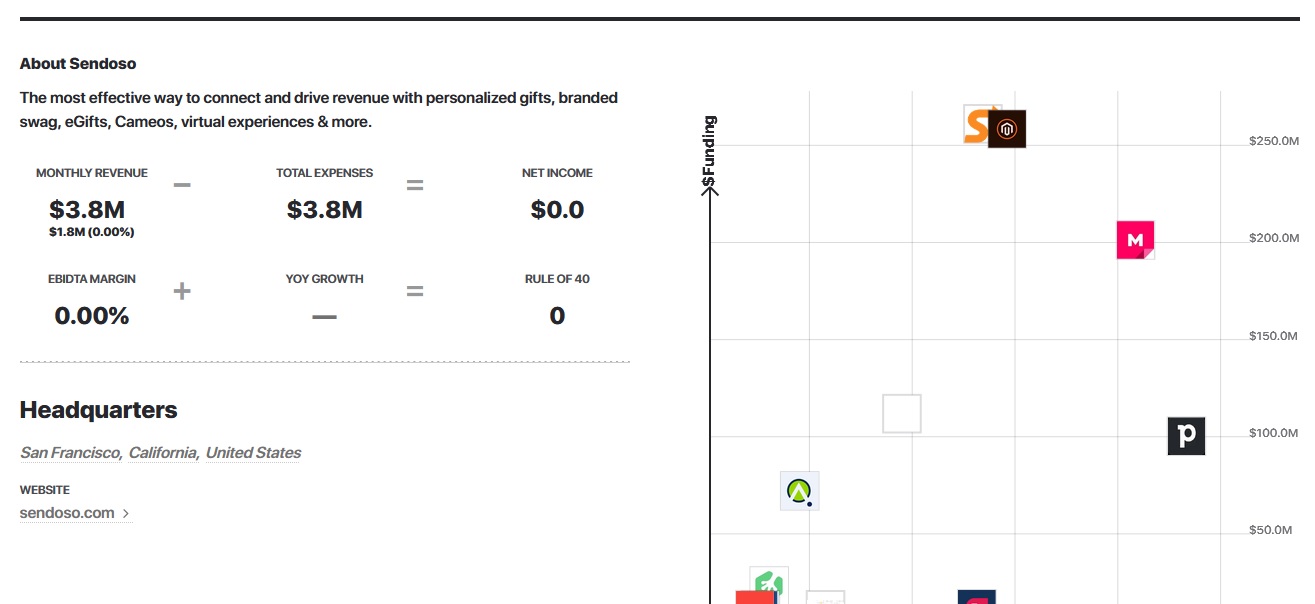
Latka
Latka is a new startup research service that targets bootstrapped companies. The LATKA SaaS database uses CEO interviews, public data, and data estimates to showcase over 30,000 SaaS companies. Where there is no CEO interview, the data is estimated. Data includes revenue, customer count, churn, customer acquisition cost, average contract values, & payback periods, among many other important SaaS data points. LATKA also runs periodic special ranking reports such as top growing SaaS companies by employee growth, bootstrapped, and sales team churn. They offer limited free views and a monthly $79 subscription to access their entire database. Some samples include:
Estimating Private Company Revenues Using the Headcount Proxy
Another tactic you can use to estimate the revenues of private companies is known as the headcount proxy. Generally, software companies in the same market targeting the same types of customers (consumers, small-to-medium businesses, mid-market, or enterprises) tend to have similar economics. A common metric is revenue/employee. If you can find some accurate information about a company’s employees and revenues, you can develop an estimate for a company’s revenues based on their headcount.
As I mentioned before, I recently had a consulting sales opportunity in the EdTech space for a privately held EdTech SaaS provider. I had worked in EdTech 20 years ago, but was not up to date on current trends. I did a basic analysis to see what the competitive landscape looked like. First I found a few public companies and reviewed their SEC filings. Then I identified a number of private companies I was interested in. I looked up their headcount information on LinkedIn. This was the result:
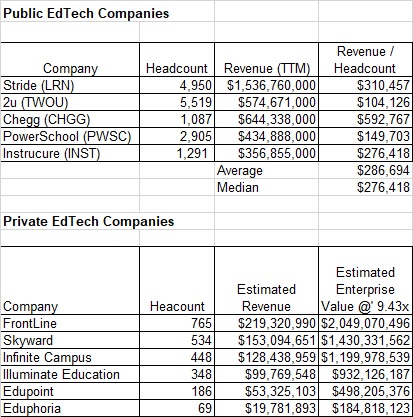
The headcount proxy technique can only be used to build a rough estimate. Whenever possible I try and correlate multiple sources to build an estimate (Google Owler, Latka, etc.) A challenge with the headcount proxy is that unless the companies you are comparing are very close competitors, the comparison may be skewed. Comparing the economics of a firm that has $20 million in annual revenue to a firm that has $1 billion is not exactly apples and oranges. If the comparable company has a large number of employees in low-cost markets that can skew the numbers too. Freshworks, a $350 million company that just went public has 3,900 of its 5,000 employees in India.
Competitor Funding
Understanding the amount of funding and the funding history of a competitor is important. It lets you know how much of a ‘war chest’ the competitor has to deploy.
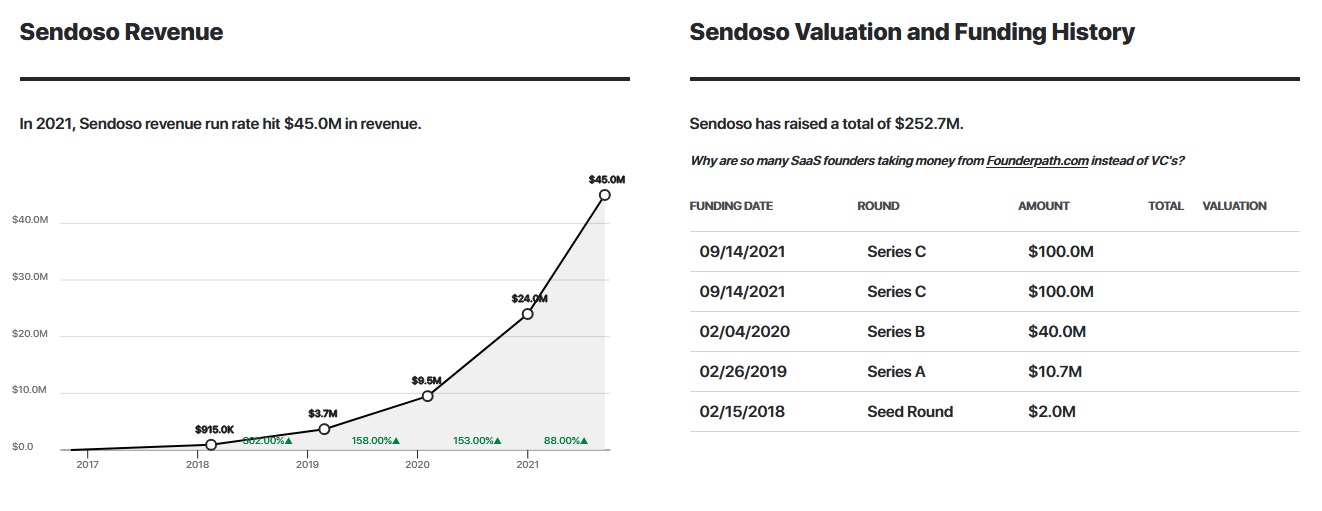
Crunchbase and Latka are two great sources of funding information:
You can infer that a company is cash-flow positive or even profitable if they have not raised any money, or it has been many years since their last raise.
Competitor Industry Analyst Reports
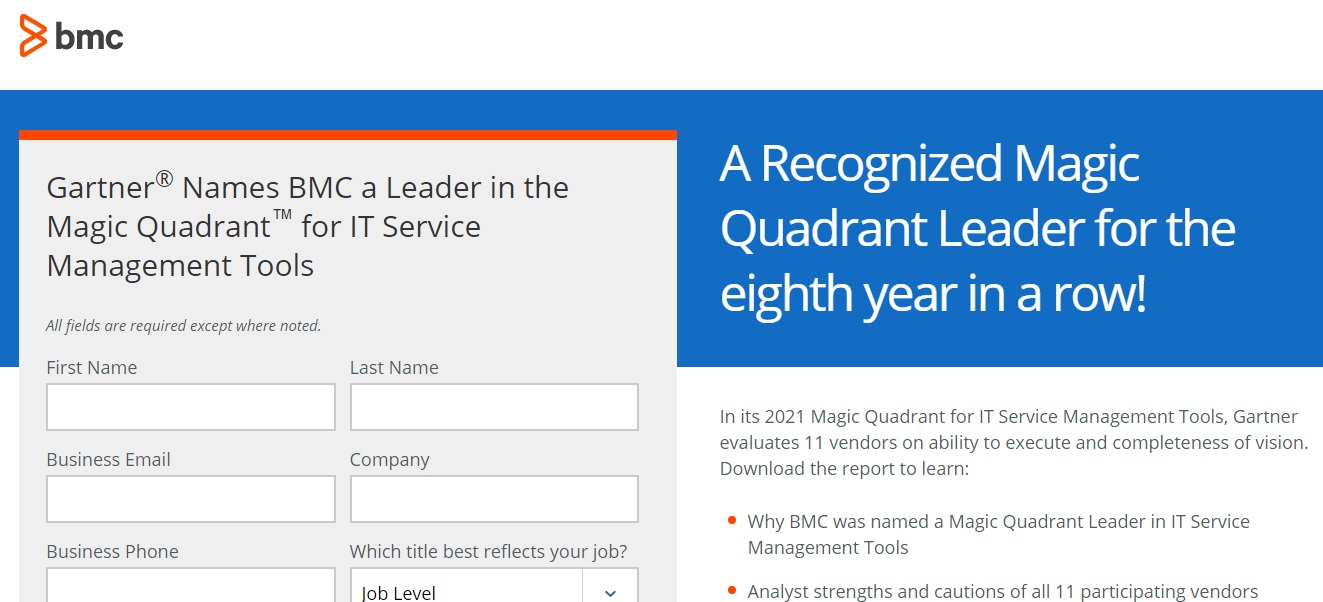
Industry analyst reports can provide great insights into competitors. In the enterprise space, inclusion in a Gartner Group Magic Quadrant can make or break a company’s sales potential. If you have a subscription to Gartner, Forrester, or Ovum use it.
If you do not have a subscription, you can sometimes find reports for free. Many vendors offer copies of reports that feature them on their websites. Simply Google vendor name + Gartner magic quadrant and see what you can find. For example, BMC offers a free copy of the I.T. Service Management MQ Report:
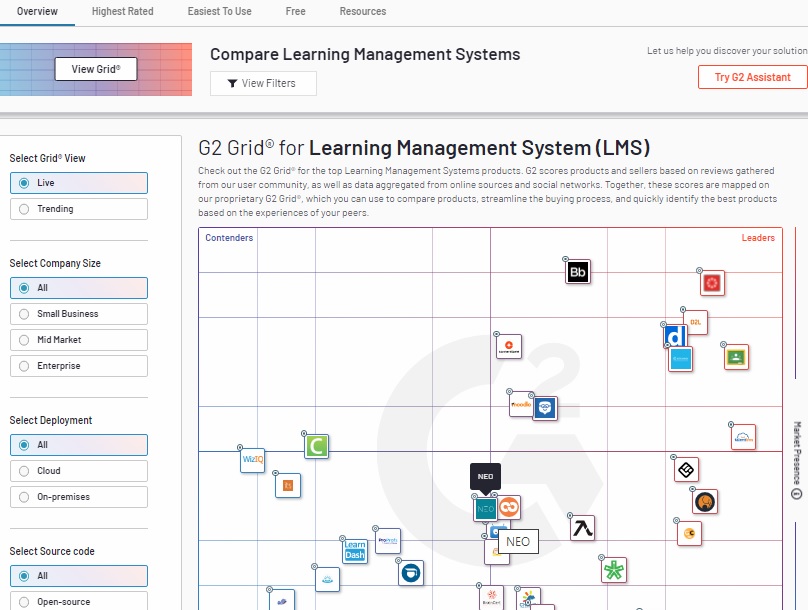
You can also check popular user review sites like G2, Capterra, or Software Advice. Some use review sites provide market summaries. Here is one from G2:
You can also do general Google searches as well. Here are two market research reports I found during my EdTech investigation:

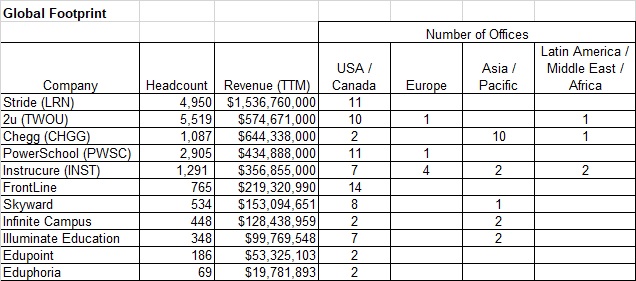
Competitor Global Footprint
Understanding where a competitor’s employees and offices are located can provide insights into their overall ability to execute. A quick review of their website, job openings, and LinkedIn can help.
Competitor Enterprise Value
Enterprise Value is the best metric to describe the value of a company. Enterprise Value is a single metric that describes how valuable a company is. It combines the value of a company’s equity(sock), revenues, profitability, cash, debt, and other factors into a single metric. It can be used to describe both public companies as well as privately-held companies.
Enterprise Value (EV) is the measure of a firm’s total value and factors in the entire market value instead of just the equity value. It includes considerations like cash, debt, and other factors. A company’s value is often described as a ratio involving Enterprise Value. Enterprise Value/Revenue (ttm) is a common metric. It describes how Enterprise Value is a multiple of its trailing twelve months revenue. According to the Software Equity Group’s research, in Q3 2021 the median SaaS company had an EV/Revenue ratio of 13.2x. In other words, the median enterprise Value was 14.3 times the size of the prior twelve months’ revenues. EV/EBITDA is another common metric. In Q2 2021 the median EV/EBITDA ratio for SaaS companies was 63.8x.
The formula for calculating Enterprise Value has seven steps::
- + common equity at market value (this line item is also known as “market cap”)
- + debt at market value (here debt refers to interest-bearing liabilities, both long-term and short-term)
- – cash and cash equivalents
- + minority interest at market value, if any
- + preferred equity at market value (preferred shares/liquidation preferences)
- +unfunded pension liabilities and other debt-deemed provisions
- – value of associate companies
Major stock reporting services (Google Finance, Yahoo Finance, NASDAQ, NYSE) automatically calculate the enterprise value of public companies. You can estimate the enterprise value of private companies. Check out How to Calculate the Enterprise Value of a Private Company
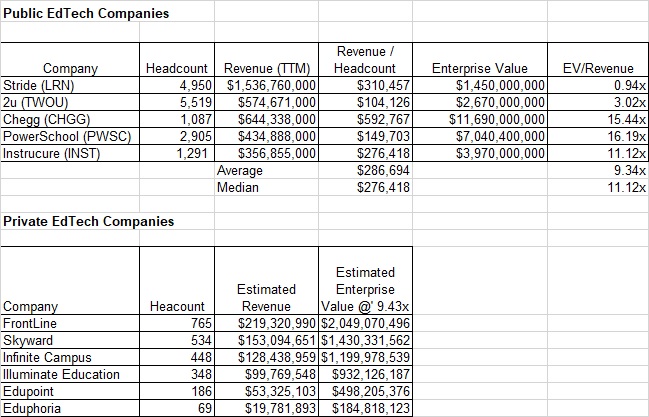
For my EdTech project, I created an enterprise value analysis:
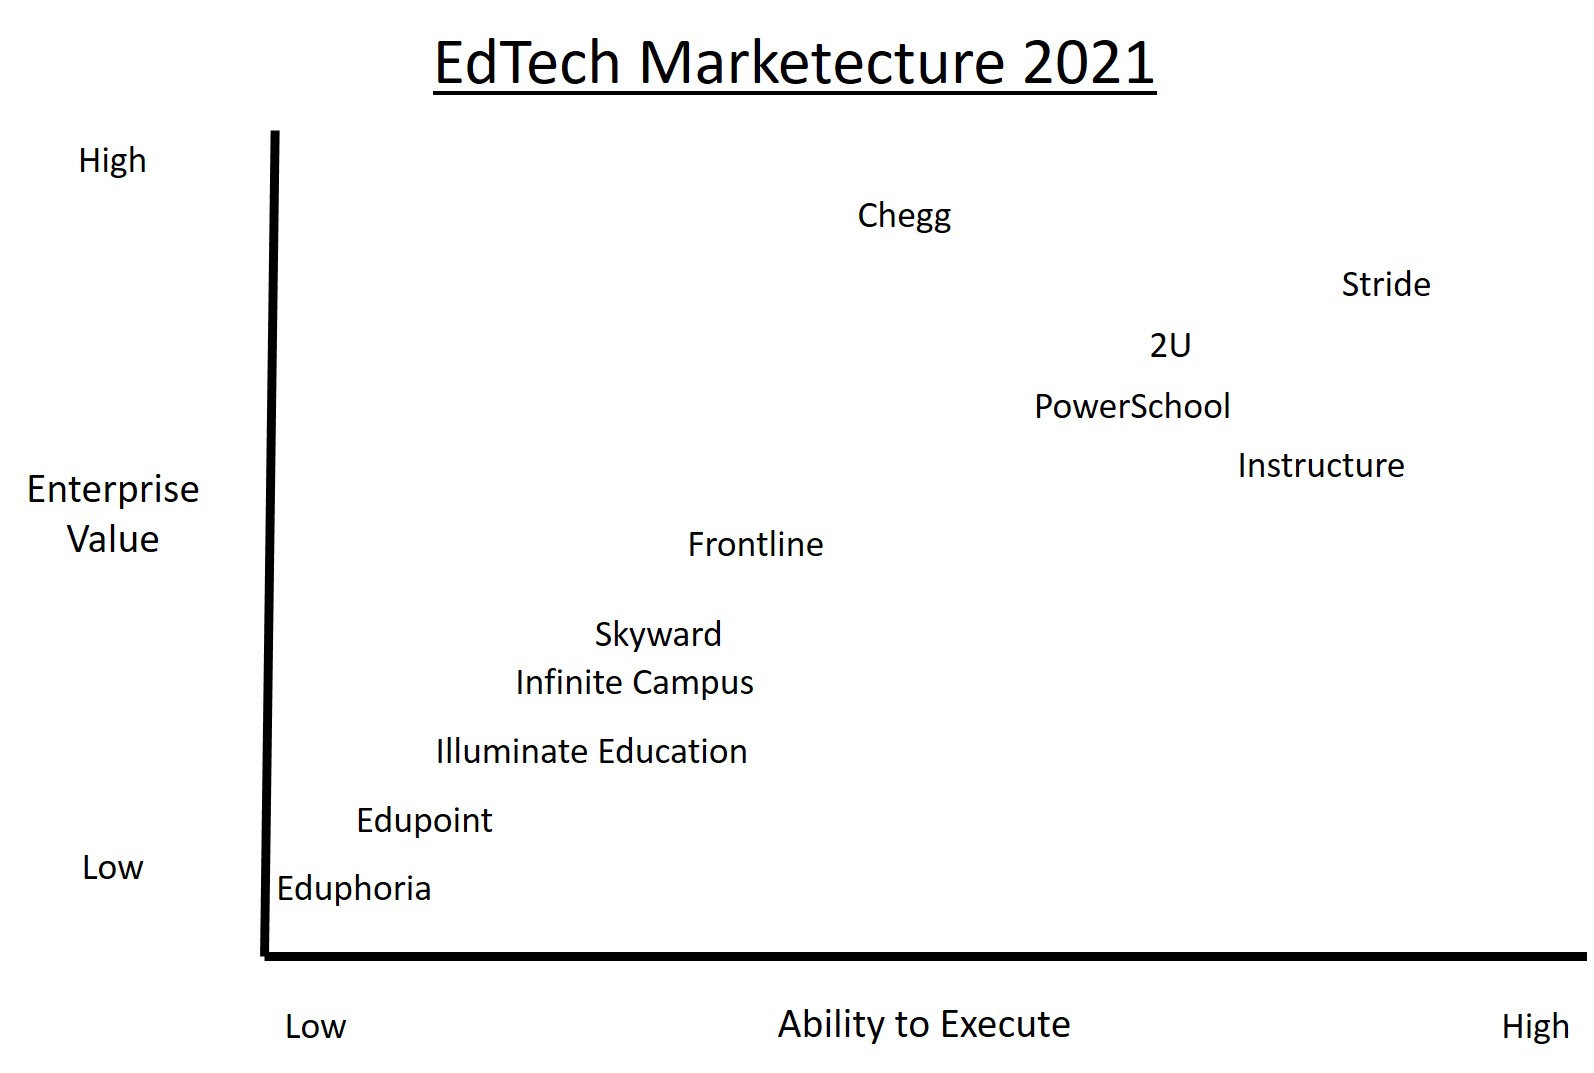
Competitor Marrketecture
Marketecture is a concept that combines several factors into one chart to show the dynamics of a particular market. It is similar in concept to the Gartner Group’s Magic Quadrant. Typically I use Enterprise Value for one axis and Ability to Execute as another. You should determine what are the relevant factors for your company. Here is a marketecture diagram I built for my EdTech project:
Summary
Competitive intelligence is a core responsibility of product management. There is more to competitive intelligence than understanding the features and functionality of competitive solutions. Product managers need to understand competitors’ revenues, headcount, funding, industry analyst relations, global footprint, and enterprise value. Product managers need to understand the business aspects of their competitors and how they stack up against their own business. Fortunately, there are many free resources and tactics product managers can use to learn about these items.